
Page 327 - Lindens Handbook of Batteries
P. 327
BUTTOn CELL BATTErIES: SILVEr OxIDE–ZInC AnD ZInC-AIr SYSTEmS 13.33
1.0
0.8 80% RH
30% KOH
P electrolyte /P water 0.6 59% RH 50% RH
33% KOH
52% RH
0.4
0.2 20% RH
0 10 20 30 40 50
% KOH
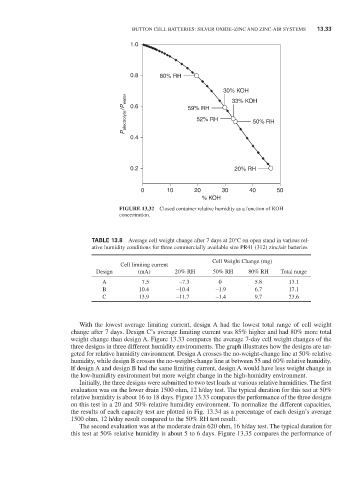
FiGURE 13.32 Closed container relative humidity as a function of KOH
concentration.
taBle 13.8 Average cell weight change after 7 days at 20°C on open stand in various rel-
ative humidity conditions for three commercially available size Pr41 (312) zinc/air batteries
Cell Weight Change (mg)
Cell limiting current
Design (mA) 20% rH 50% rH 80% rH Total range
A 7.5 –7.3 0 5.8 13.1
B 10.4 –10.4 –1.9 6.7 17.1
C 13.9 –11.7 –1.4 9.7 23.6
With the lowest average limiting current, design A had the lowest total range of cell weight
change after 7 days. Design C’s average limiting current was 85% higher and had 80% more total
weight change than design A. Figure 13.33 compares the average 7-day cell weight changes of the
three designs in three different humidity environments. The graph illustrates how the designs are tar-
geted for relative humidity environment. Design A crosses the no-weight-change line at 50% relative
humidity, while design B crosses the no-weight-change line at between 55 and 60% relative humidity.
If design A and design B had the same limiting current, design A would have less weight change in
the low-humidity environment but more weight change in the high-humidity environment.
Initially, the three designs were submitted to two test loads at various relative humidities. The first
evaluation was on the lower drain 1500 ohm, 12 h/day test. The typical duration for this test at 50%
relative humidity is about 16 to 18 days. Figure 13.33 compares the performance of the three designs
on this test in a 20 and 50% relative humidity environment. To normalize the different capacities,
the results of each capacity test are plotted in Fig. 13.34 as a percentage of each design’s average
1500 ohm, 12 h/day result compared to the 50% rH test result.
The second evaluation was at the moderate drain 620 ohm, 16 h/day test. The typical duration for
this test at 50% relative humidity is about 5 to 6 days. Figure 13.35 compares the performance of