
Page 124 - MATLAB an introduction with applications
P. 124
Electrical Circuits ——— 109
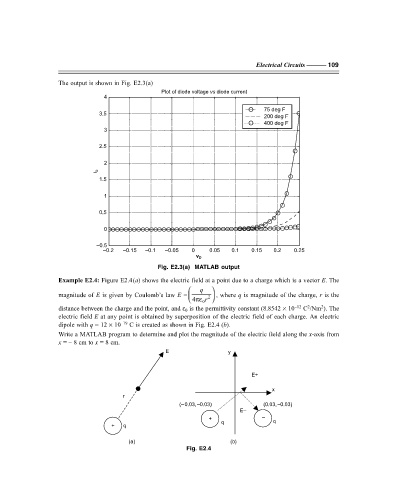
The output is shown in Fig. E2.3(a)
Plot of diode voltage vs diode current
4
75 deg F
3.5
200 deg F
400 deg F
3
2.5
2
i D
1.5
1
0.5
0
–0.5
–0.2 –0.15 –0.1 –0.05 0 0.05 0.1 0.15 0.2 0.25
v D
Fig. E2.3(a) MATLAB output
Example E2.4: Figure E2.4(a) shows the electric field at a point due to a charge which is a vector E. The
q
magnitude of E is given by Coulomb’s law E = 4πε r , where q is magnitude of the charge, r is the
2
0
2
distance between the charge and the point, and ε 0 is the permittivity constant (8.8542 × 10 –12 C /Nm ). The
2
electric field E at any point is obtained by superposition of the electric field of each charge. An electric
dipole with q = 12 × 10 –19 C is created as shown in Fig. E2.4 (b).
Write a MATLAB program to determine and plot the magnitude of the electric field along the x-axis from
x = – 8 cm to x = 8 cm.
E y
E+
x
r
(–0.03,–0.03) (0.03,–0.03)
E–
+ –
q q
+ q
(a) (b)
Fig. E2.4
F:\Final Book\Sanjay\IIIrd Printout\Dt. 10-03-09