
Page 128 - MATLAB an introduction with applications
P. 128
Electrical Circuits ——— 113
o
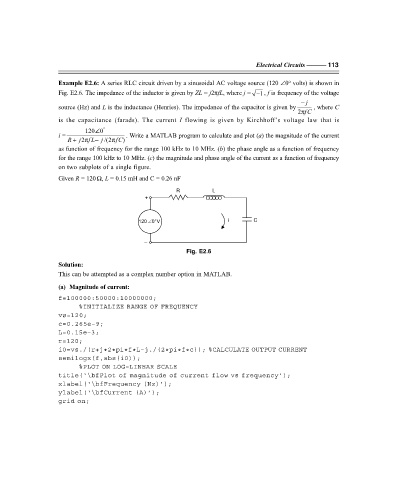
Example E2.6: A series RLC circuit driven by a sinusoidal AC voltage source (120 ∠0 volts) is shown in
Fig. E2.6. The impedance of the inductor is given by ZL = j2πfL, where j = − , f is frequency of the voltage
1
− j
source (Hz) and L is the inductance (Henries). The impedance of the capacitor is given by , where C
π
2 fC
is the capacitance (farads). The current I flowing is given by Kirchhoff’s voltage law that is
∠
120 0 °
i = . Write a MATLAB program to calculate and plot (a) the magnitude of the current
−
R + j 2πf L j /(2πfC )
as function of frequency for the range 100 kHz to 10 MHz. (b) the phase angle as a function of frequency
for the range 100 kHz to 10 MHz. (c) the magnitude and phase angle of the current as a function of frequency
on two subplots of a single figure.
Given R = 120Ω, L = 0.15 mH and C = 0.26 nF
R L
+
120 ∠0°V i C
–
Fig. E2.6
Solution:
This can be attempted as a complex number option in MATLAB.
(a) Magnitude of current:
f=100000:50000:10000000;
%INITIALIZE RANGE OF FREQUENCY
vs=120;
c=0.265e–9;
L=0.15e–3;
r=120;
i0=vs./(r+j*2*pi*f*L–j./(2*pi *f*c)); %CALCULATE OUTPUT CURRENT
semilogx(f,abs(i0));
%PLOT ON LOG–LINEAR SCALE
title(‘\bfPlot of magnitude of current flow vs frequency’);
xlabel(‘\bfFrequency (Hz)’);
ylabel(‘\bfCurrent (A)’);
grid on;
F:\Final Book\Sanjay\IIIrd Printout\Dt. 10-03-09