
Page 127 - MATLAB an introduction with applications
P. 127
112 ——— MATLAB: An Introduction with Applications
Solution:
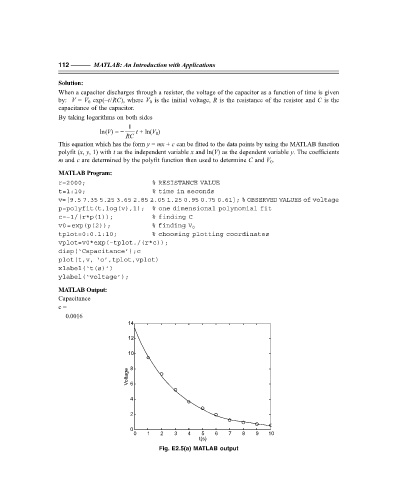
When a capacitor discharges through a resistor, the voltage of the capacitor as a function of time is given
by: V = V 0 exp(–t/RC), where V 0 is the initial voltage, R is the resistance of the resistor and C is the
capacitance of the capacitor.
By taking logarithms on both sides
1
ln(V) = − t + ln(V 0 )
RC
This equation which has the form y = mx + c can be fitted to the data points by using the MATLAB function
polyfit (x, y, 1) with t as the independent variable x and ln(V) as the dependent variable y. The coefficients
m and c are determined by the polyfit function then used to determine C and V 0 .
MATLAB Program:
r=2000; % RESISTANCE VALUE
t=1:10; % time in seconds
v=[9.5 7.35 5.25 3.65 2.85 2.05 1.25 0.95 0.75 0.61]; % OBSERVED VALUES of voltage
p=polyfit(t,log(v),1); % one dimensional polynomial fit
c=–1/(r*p(1)); % finding C
v0=exp(p(2)); % finding V 0
tplot=0:0.1:10; % choosing plotting coordinates
vplot=v0*exp(–tplot./(r*c));
disp(‘Capacitance’);c
plot(t,v, ‘o’,tplot,vplot)
xlabel(‘t(s)’)
ylabel(‘voltage’);
MATLAB Output:
Capacitance
c =
0.0016
14
12
10
Voltage 8 6
4
2
0
0 1 2 3 4 5 6 7 8 9 10
t(s)
Fig. E2.5(a) MATLAB output
F:\Final Book\Sanjay\IIIrd Printout\Dt. 10-03-09