
Page 130 - MATLAB an introduction with applications
P. 130
Electrical Circuits ——— 115
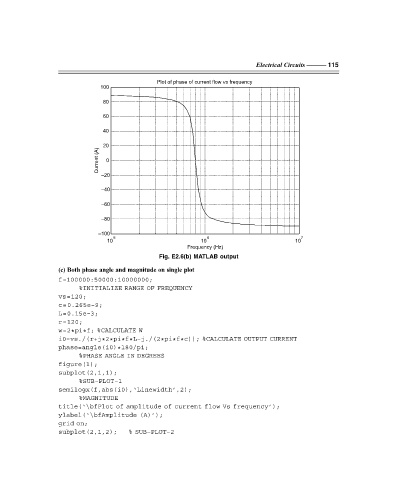
Plot of phase of current flow vs frequency
100
80
60
40
20
(A)
Current 0
–20
–40
–60
–80
–100
5 6 7
10 10 10
Frequency (Hz)
Fig. E2.6(b) MATLAB output
(c) Both phase angle and magnitude on single plot
f=100000:50000:10000000;
%INITIALIZE RANGE OF FREQUENCY
vs=120;
c=0.265e–9;
L=0.15e–3;
r=120;
w=2 * pi * f; %CALCULATE W
i0=vs./(r+j*2*pi*f*L–j./(2*pi*f*c)); %CALCULATE OUTPUT CURRENT
phase=angle(i0)*180/pi;
%PHASE ANGLE IN DEGREES
figure(1);
subplot(2,1,1);
%SUB–PLOT–1
semilogx(f,abs(i0),‘Linewidth’,2);
%MAGNITUDE
title(‘\bfPlot of amplitude of current flow Vs frequency’);
ylabel(‘\bfAmplitude (A)’);
grid on;
subplot(2,1,2); % SUB–PLOT–2
F:\Final Book\Sanjay\IIIrd Printout\Dt. 10-03-09