
Page 129 - MATLAB an introduction with applications
P. 129
114 ——— MATLAB: An Introduction with Applications
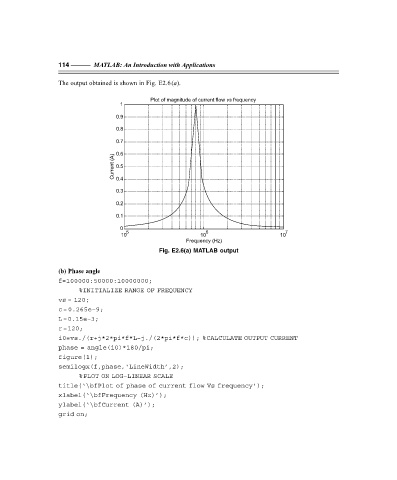
The output obtained is shown in Fig. E2.6(a).
Plot of magnitude of current flow vs frequency
1
0.9
0.8
0.7
(A) 0.6
Current 0.5
0.4
0.3
0.2
0.1
0
5 6 7
10 10 10
Frequency (Hz)
Fig. E2.6(a) MATLAB output
(b) Phase angle
f=100000:50000:10000000;
%INITIALIZE RANGE OF FREQUENCY
vs = 120;
c=0.265e–9;
L=0.15e–3;
r=120;
i0=vs./(r+j*2*pi*f*L–j./(2*pi*f*c)); %CALCULATE OUTPUT CURRENT
phase = angle(i0)*180/pi;
figure(1);
semilogx(f,phase,‘LineWidth’,2);
%PLOT ON LOG–LINEAR SCALE
title(‘\bfPlot of phase of current flow Vs frequency’);
xlabel(‘\bfFrequency (Hz)’);
ylabel(‘\bfCurrent (A)’);
grid on;
F:\Final Book\Sanjay\IIIrd Printout\Dt. 10-03-09