
Page 126 - MATLAB an introduction with applications
P. 126
Electrical Circuits ——— 111
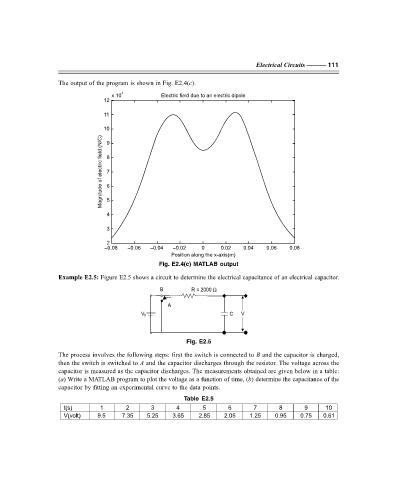
The output of the program is shown in Fig. E2.4(c).
4
x10 Electric field due to an electric dipole
12
11
10
(N/C) 9
field 8
electric 7
of 6
Magnitude 5
4
3
2
–0.08 –0.06 –0.04 –0.02 0 0.02 0.04 0.06 0.08
Position along the x-axis(m)
Fig. E2.4(c) MATLAB output
Example E2.5: Figure E2.5 shows a circuit to determine the electrical capacitance of an electrical capacitor.
B R = 2000 Ω
A
C V
V 0
Fig. E2.5
The process involves the following steps: first the switch is connected to B and the capacitor is charged,
then the switch is switched to A and the capacitor discharges through the resistor. The voltage across the
capacitor is measured as the capacitor discharges. The measurements obtained are given below in a table:
(a) Write a MATLAB program to plot the voltage as a function of time, (b) determine the capacitance of the
capacitor by fitting an experimental curve to the data points.
Table E2.5
t(s) 1 2 3 4 5 6 7 8 9 10
V(volt) 9.5 7.35 5.25 3.65 2.85 2.05 1.25 0.95 0.75 0.61
F:\Final Book\Sanjay\IIIrd Printout\Dt. 10-03-09