
Page 135 - Marks Calculation for Machine Design
P. 135
P1: Sanjay
January 4, 2005
Brown˙C02
Brown.cls
V
0 16:18 BEAMS x 117
L
–
–wL
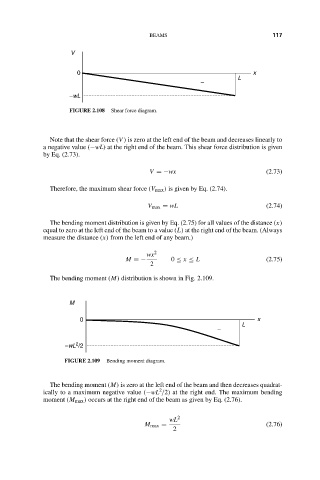
FIGURE 2.108 Shear force diagram.
Note that the shear force (V ) is zero at the left end of the beam and decreases linearly to
a negative value (−wL) at the right end of the beam. This shear force distribution is given
by Eq. (2.73).
V =−wx (2.73)
Therefore, the maximum shear force (V max ) is given by Eq. (2.74).
V max = wL (2.74)
The bending moment distribution is given by Eq. (2.75) for all values of the distance (x)
equal to zero at the left end of the beam to a value (L) at the right end of the beam. (Always
measure the distance (x) from the left end of any beam.)
wx 2
M =− 0 ≤ x ≤ L (2.75)
2
The bending moment (M) distribution is shown in Fig. 2.109.
M
0 x
L
–
2
–wL /2
FIGURE 2.109 Bending moment diagram.
The bending moment (M) is zero at the left end of the beam and then decreases quadrat-
2
ically to a maximum negative value (−wL /2) at the right end. The maximum bending
moment (M max ) occurs at the right end of the beam as given by Eq. (2.76).
wL 2
M max = (2.76)
2