
Page 261 - Materials Chemistry, Second Edition
P. 261
248 4 Semiconductors
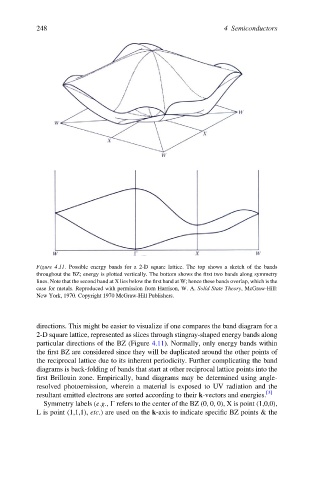
Figure 4.11. Possible energy bands for a 2-D square lattice. The top shows a sketch of the bands
throughout the BZ; energy is plotted vertically. The bottom shows the first two bands along symmetry
lines. Note that the second band at X lies below the first band at W; hence these bands overlap, which is the
case for metals. Reproduced with permission from Harrison, W. A. Solid State Theory, McGraw-Hill:
New York, 1970. Copyright 1970 McGraw-Hill Publishers.
directions. This might be easier to visualize if one compares the band diagram for a
2-D square lattice, represented as slices through stingray-shaped energy bands along
particular directions of the BZ (Figure 4.11). Normally, only energy bands within
the first BZ are considered since they will be duplicated around the other points of
the reciprocal lattice due to its inherent periodicity. Further complicating the band
diagrams is back-folding of bands that start at other reciprocal lattice points into the
first Brillouin zone. Empirically, band diagrams may be determined using angle-
resolved photoemission, wherein a material is exposed to UV radiation and the
resultant emitted electrons are sorted according to their k-vectors and energies. [3]
Symmetry labels (e.g., G refers to the center of the BZ (0, 0, 0), X is point (1,0,0),
L is point (1,1,1), etc.) are used on the k-axis to indicate specific BZ points & the