
Page 368 - Matrix Analysis & Applied Linear Algebra
P. 368
364 Chapter 5 Norms, Inner Products, and Orthogonality
symmetric about the point n/2in the frequency domain, and the information in
just the first (or second) half of the frequency domain completely characterizes
the original waveform—this is why only 512/2=256 points are plotted in the
graphs shown in Figure 5.8.4. In other words, if
2
y = F n x = α k (e f k + e n−f k )+i β k (−e f k + e n−f k ) , (5.8.8)
n
k k
then the information in
y n/2 = α k e f k − i β k e f k (the first half of y )
k k
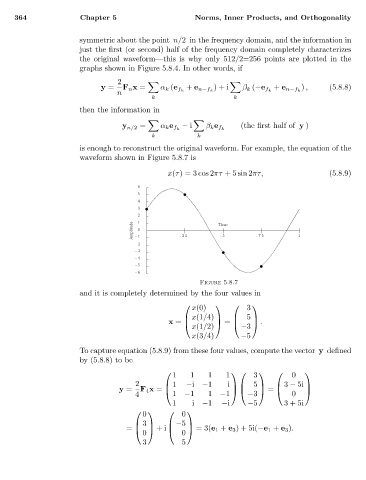
is enough to reconstruct the original waveform. For example, the equation of the
waveform shown in Figure 5.8.7 is
x(τ)=3 cos 2πτ +5 sin 2πτ, (5.8.9)
6
5
4
3
2 1
Amplitude -1 0 .25 Time .75 1
.5
-2
-3
-4
-5
-6
Figure 5.8.7
and it is completely determined by the four values in
x(0) 3
.
x(1/4) 5
x(1/2) = −3
x =
x(3/4) −5
To capture equation (5.8.9) from these four values, compute the vector y defined
by (5.8.8) to be
1 1 1 1 3 0
2 1 −i −1
y = i 5 3 − 5i
4 F 4 x = 1 −1 1 −1 −3 = 0
1 i −1 −i −5 3+5i
0 0
=3(e 1 + e 3 )+ 5i(−e 1 + e 3 ).
3 −5
0 0
= +i
3 5