
Page 189 - Mechanics Analysis Composite Materials
P. 189
174 Mechanics and analysis of composite materials
in the central cross-section x = 0 of the central block in Fig. 4.39 (as well as in all
the other blocks). Thus, the distance between the cracks becomes I, = 7~/2k2(6.4
mm for the example under study). The corresponding stress distribution can be
determined with the aid of Eqs. (4.1 14) and (4.1 18) and boundary conditions (4.1 19)
in which we should take i, = 7r/2k2. The next crack will again appear at the block
center and this process will be continued until the failure of longitudinal plies.
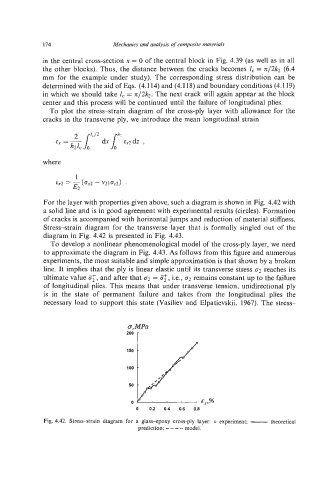
To plot the stress-strain diagram of the cross-ply layer with allowance for the
cracks in the transverse ply, we introduce the mean longitudinal strain
where
For the layer with properties given above, such a diagram is shown in Fig. 4.42 with
a solid line and is in good agreement with experimental results (circles). Formation
of cracks is accompanied with horizontal jumps and reduction of material stiffness.
Stress-strain diagram for the transverse layer that is formally singled out of the
diagram in Fig. 4.42 is presented in Fig. 4.43.
To develop a nonlinear phenomenological model of the cross-ply layer, we need
to approximate the diagram in Fig. 4.43. As follows from this figure and numerous
experiments, the most suitable and simple approximation is that shown by a broken
line. It implies that the ply is linear elastic until its transverse stress 02 reaches its
ultimate value a;, and after that 02 = a;, Le., a2 remains constant up to the failure
of longitudinal plies. This means that under transverse tension, unidirectional ply
is in the state of permanent failure and takes from the longitudinal plies the
necessary load to support this state (Vasiliev and Elpatievskii, 1967). The stress-
0 0.2 0.4 0.6 0.8
Fig. 4.42. Stress-strain diagram for a glass-epoxy cross-ply layer: o experiment; -theoretical
prediction; ---- model.