
Page 212 - Mechanics Analysis Composite Materials
P. 212
Chapter 4. Mechanics ofa composire layer 197
E*, Y,2.%
0 1 2 3
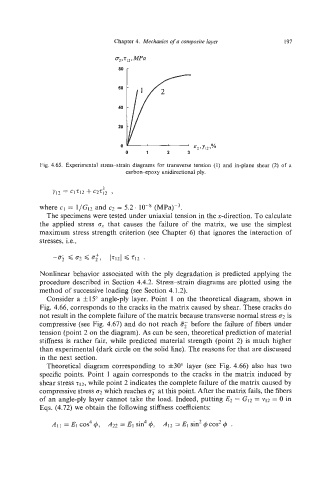
Fig. 4.65. Experimental stressstrain diagrams for transverse tension (1) and in-plane shear (2)of a
carbon-poxy unidirectional ply.
3
Y12 = Cl7l2 + C2Tl2 ,
where cl = I/G,2 and c2 = 5.2. (MPa)-3.
The specimens were tested under uniaxial tension in the x-direction. To calculate
the applied stress ox that causes the failure of the matrix, we use the simplest
maximum stress strength criterion (see Chapter 6) that ignores the interaction of
stresses, i.e.,
Nonlinear behavior associated with the ply degradation is predicted applying the
procedure described in Section 4.4.2. Stress-strain diagrams are plotted using the
method of successive loading (see Section 4.1.2).
Consider a f15" angle-ply layer. Point 1 on the theoretical diagram, shown in
Fig. 4.66, corresponds to the cracks in the matrix caused by shear. These cracks do
not result in the complete failure of the matrix because transverse normal stress 02 is
compressive (see Fig. 4.67) and do not reach 8; before the failure of fibers under
tension (point 2 on the diagram). As can be seen, theoretical prediction of material
stiffness is rather fair, while predicted material strength (point 2) is much higher
than experimental (dark circle on the solid line). The reasons for that are discussed
in the next section.
Theoretical diagram corresponding to f30" layer (see Fig. 4.66) also has two
specific points. Point 1 again corresponds to the cracks in the matrix induced by
shear stress 212, while point 2 indicates the complete failure of the matrix caused by
compressivestress 02 which reaches if? at this point. After the matrix fails, the fibers
of an angle-ply layer cannot take the load. Indeed, putting E2 = G12 = v12 = 0 in
Eqs. (4.72) we obtain the following stiffness coefficients:
All = El cos44, A22 = El sin44, A12 = El sin24cos2 .