
Page 168 -
P. 168
158 4 Optical Rotor
Table 4.7. Effect of the tracer on the images of the visualized microflow
tracer (size)glycerol (%) visualization
tracer optical
polystyrene (0.5 µm)50 × ×
polystyrene (1.0 µm)30 ×
glass (0.5 µm)50 × ×
glass (1.0 µm)30 ×
aluminum (1.0 µm)30 × ×
gold (0.5 µm)50 × ×
milk fat colloid 30
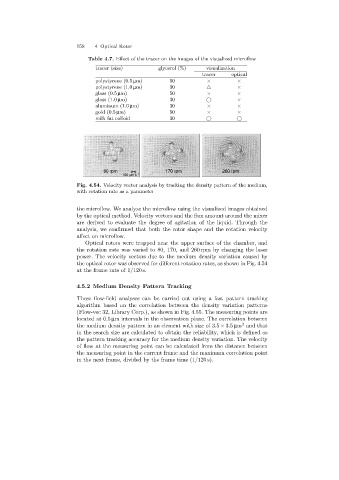
80 rpm 170 rpm 260 rpm
100 mm s -1
Fig. 4.54. Velocity vector analysis by tracking the density pattern of the medium,
with rotation rate as a parameter
the microflow. We analyze the microflow usingthe visualized images obtained
by the optical method. Velocity vectors and the flux amount around the mixer
are derived to evaluate the degree of agitation of the liquid. Through the
analysis, we confirmed that both the rotor shape and the rotation velocity
affect on microflow.
Optical rotors were trapped near the upper surface of the chamber, and
the rotation rate was varied to 80, 170, and 260 rpm by changing the laser
power. The velocity vectors due to the medium density variation caused by
the optical rotor was observed for different rotation rates, as shown in Fig. 4.54
at the frame rate of 1/120 s.
4.5.2 Medium Density Pattern Tracking
These flow-field analyses can be carried out usinga fast pattern tracking
algorithm based on the correlation between the density variation patterns
(Flow-vec 32, Library Corp.), as shown in Fig. 4.55. The measuring points are
located at 0.5 µm intervals in the observation plane. The correlation between
2
the medium density pattern in an element with size of 3.5 × 3.5 µm and that
in the search size are calculated to obtain the reliability, which is defined as
the pattern trackingaccuracy for the medium density variation. The velocity
of flow at the measuringpoint can be calculated from the distance between
the measuringpoint in the current frame and the maximum correlation point
in the next frame, divided by the frame time (1/120 s).