
Page 167 -
P. 167
4.5 Evaluation 157
40
#2
35 #3
#4
30
Velocity (mm s -1 ) 25
20
15
10
5
0
0.0 0.5 1.0 1.5 2.0 2.5
Time (s)
Fig. 4.52. Variation in tracer velocity due to the flow generated by the rotor and
the Brownian motion. Notation # corresponds to that of Fig. 4.51
Focus point
10 mm
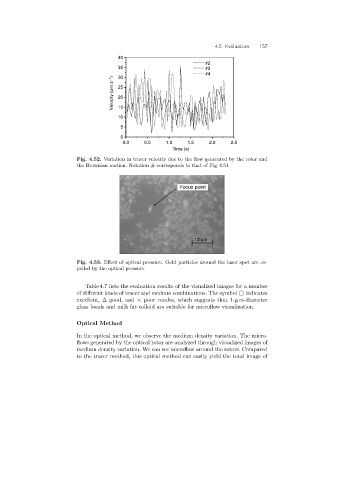
Fig. 4.53. Effect of optical pressure. Gold particles around the laser spot are ex-
pelled by the optical pressure
Table 4.7 lists the evaluation results of the visualized images for a number
of different kinds of tracer and medium combinations. The symbol indicates
excellent, ∆ good, and × poor results, which suggests that 1-µ m-diameter
glass beads and milk fat colloid are suitable for microflow visualization.
Optical Method
In the optical method, we observe the medium density variation. The micro-
flows generated by the optical rotor are analyzed through visualized images of
medium density variation. We can see microflow around the rotors. Compared
to the tracer method, this optical method can easily yield the total image of