
Page 169 -
P. 169
4.5 Evaluation 159
54 mm
Element size
(3.5 mm)
40
mm Measuring interval
point (0.5 mm)
Search size
Velocity vector
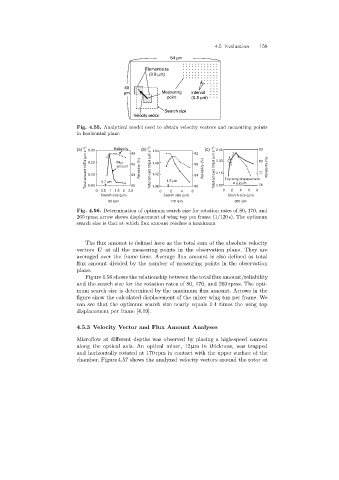
Fig. 4.55. Analytical model used to obtain velocity vectors and measuring points
in horizontal plane
Total amount 10E4 (mm s -1 ) 8.23 Flux 96 Reliability (%) Total amount 10E4 (mm s -1 ) 1.48 88 Reliability (%) Total amount 10E4 (mm s -1 ) 2.30 Top wing displacement 80 Reliability (%)
(a) 8.33 Reliability 99 (b) 1.54 92 (c) 2.45 83
amount
2.15
77
1.42
8.13
93
84
8.03
4
0 0.7 mm 1.5 2 2.5 90 1.36 0 1.5 mm 4 6 80 2.00 0 2 2.2 mm 6 8 74
1
0.5
2
Search size (mm) Search size (mm) Search size (mm)
80 rpm 170 rpm 260 rpm
Fig. 4.56. Determination of optimum search size for rotation rates of 80, 170, and
260 rpms; arrow shows displacement of wing top per frame (1/120 s). The optimum
search size is that at which flux amount reaches a maximum
The flux amount is defined here as the total sum of the absolute velocity
vectors U at all the measuringpoints in the observation plane. They are
averaged over the frame time. Average flux amount is also defined as total
flux amount divided by the number of measuringpoints in the observation
plane.
Figure 4.56 shows the relationship between the total flux amount/reliability
and the search size for the rotation rates of 80, 170, and 260 rpms. The opti-
mum search size is determined by the maximum flux amount. Arrows in the
figure show the calculated displacement of the mixer wing top per frame. We
can see that the optimum search size nearly equals 1.4 times the wingtop
displacement per frame [4.19].
4.5.3 Velocity Vector and Flux Amount Analyses
Microflow at different depths was observed by placinga high-speed camera
alongthe optical axis. An optical mixer, 12 µm in thickness, was trapped
and horizontally rotated at 170 rpm in contact with the upper surface of the
chamber. Figure 4.57 shows the analyzed velocity vectors around the rotor at