
Page 127 - MODELING OF ASPHALT CONCRETE
P. 127
Complex Modulus Characterization of Asphalt Concr ete 105
• Engineering behavioral characteristics of the material can cause the response
curve to deviate from one which mirrors the forcing function. Characteristics
that are important in causing these deviations include anisotropy (transversely
isotropic and orthotropic degrees of anisotropy are particularly relevant to
asphalt which has been compacted in the field or in a gyratory compactor), and
what are sometimes referred to as bimodular properties.
An additional response occurs if there are phenomena such as damage or strain
softening embedded in the creep response. If, in each cycle of loading, the stress
changes from compression to either extension or tension, an additional response
called the Bauschinger effect (Chen and Han 1988) arises from plasticity theory. Since it
is relatively unimportant to differentiate between strain softening and the Bauschinger
effect, a single plasticity/damage response is the final component of a generalized
strain response curve in which plasticity/damage effects may cause changes in
response amplitude over time.
Studied Analysis Techniques
The three studied data filtering methods were (1) no filtering, (2) Spencer’s 15 point, and
(3) regression; the two-phase referencing methods were (1) peak picking and (2) central
waveform bracketing. These produced seven combinations of analyzed methods. Methods
A and B deviate only in how the phase angle is obtained, as do methods E and F:
• Method A: Spencer’s 15-point data filtering and central waveform bracketing
• Method B: Spencer’s 15-point data filtering and peak picking
• Method C: Second-order polynomial over 25% of data and peak picking
• Method D: Second-order polynomial over 10% of data and peak picking
• Method E: No filtering and central waveform bracketing
• Method F: No filtering and peak picking
• Method G: Sinusoidal over 100% of data and regression coefficients
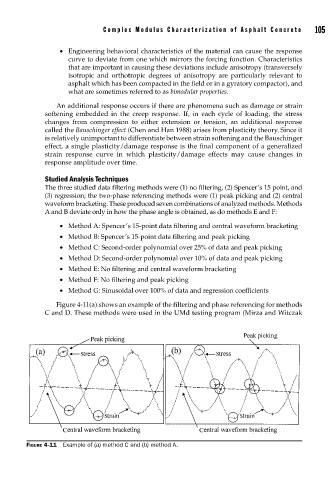
Figure 4-11(a) shows an example of the filtering and phase referencing for methods
C and D. These methods were used in the UMd testing program (Mirza and Witczak
FIGURE 4-11 Example of (a) method C and (b) method A.