
Page 129 - MODELING OF ASPHALT CONCRETE
P. 129
Complex Modulus Characterization of Asphalt Concr ete 107
−9°C 4.4°C 21.1°C 37.8°C 54.4°C
∗
∗
∗
∗
∗
|E | Se |E | Se |E | Se |E | Se |E | Se
Hz Case (MPa) (%) (MPa) (%) (MPa) (%) (MPa) (%) (MPa) (%)
25 A,B 16825 0.3 9762 0.2 4229 0.8 814 0.7 280 0.5
C 16759 0.3 9686 0.3 4234 0.7 810 0.6 276 0.4
D 16876 0.4 9748 0.4 4243 0.7 815 0.9 282 0.4
E,F 16576 0.5 9563 0.3 4074 1.5 777 0.6 282 0.5
G 16734 – 9673 – 4233 – 810 – 272 –
5 A,B 14129 0.3 7553 0.4 2544 0.6 451 1.1 199 0.8
C 14401 0.2 7618 0.1 2606 0.2 452 0.5 195 0.6
D 14186 0.2 7581 0.1 2558 0.4 444 0.8 194 1.0
E,F 13682 0.4 7464 0.5 2533 0.7 452 1.2 200 0.8
G 14324 – 7562 – 2567 – 450 – 194 –
0.1 A,B 8928 0.3 3185 0.2 831 0.4 173 0.6 128 0.4
C 8881 0.2 3181 0.1 828 0.2 173 0.4 124 0.3
D 8923 0.3 3185 0.2 827 0.1 173 0.5 128 0.4
E,F 8795 0.3 3160 0.2 817 1.0 174 0.9 131 0.9
G 8720 – 2973 – 750 – 166 – 118 –
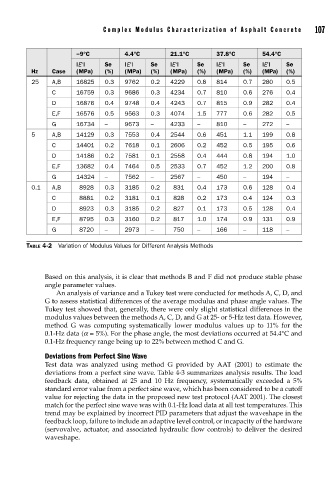
TABLE 4-2 Variation of Modulus Values for Different Analysis Methods
Based on this analysis, it is clear that methods B and F did not produce stable phase
angle parameter values.
An analysis of variance and a Tukey test were conducted for methods A, C, D, and
G to assess statistical differences of the average modulus and phase angle values. The
Tukey test showed that, generally, there were only slight statistical differences in the
modulus values between the methods A, C, D, and G at 25- or 5-Hz test data. However,
method G was computing systematically lower modulus values up to 11% for the
0.1-Hz data (a = 5%). For the phase angle, the most deviations occurred at 54.4°C and
0.1-Hz frequency range being up to 22% between method C and G.
Deviations from Perfect Sine Wave
Test data was analyzed using method G provided by AAT (2001) to estimate the
deviations from a perfect sine wave. Table 4-3 summarizes analysis results. The load
feedback data, obtained at 25 and 10 Hz frequency, systematically exceeded a 5%
standard error value from a perfect sine wave, which has been considered to be a cutoff
value for rejecting the data in the proposed new test protocol (AAT 2001). The closest
match for the perfect sine wave was with 0.1-Hz load data at all test temperatures. This
trend may be explained by incorrect PID parameters that adjust the waveshape in the
feedback loop, failure to include an adaptive level control, or incapacity of the hardware
(servovalve, actuator, and associated hydraulic flow controls) to deliver the desired
waveshape.