
Page 130 - MODELING OF ASPHALT CONCRETE
P. 130
108 Cha pte r F o u r
−9°C 4.4°C 21.1°C 37.8°C 54.4°C
Se Se Se Se Se
Hz Case j (°) (%) j (°) (%) j (°) (%) j (°) (%) j (°) (%)
25 A 10.2 1.7 17.4 2.4 31.0 1.4 34.1 4.2 32.7 1.1
B 7.2 25.0 19.8 9.1 41.4 5.3 41.4 8.7 43.2 7.8
C 9.0 5.0 18.2 1.6 32.0 1.6 34.5 1.2 33.2 0.6
D 9.9 6.8 20.0 4.5 42.8 7.8 39.0 4.3 40.7 3.7
E 9.9 3.2 17.3 1.8 31.8 2.4 34.4 7.0 32.9 1.8
F 7.2 61.2 14.4 15.3 43.2 12.1 48.6 12.6 50.4 4.4
G 10.8 – 19.5 – 33.1 – 36.8 – 34.7 –
5 A 12.1 1.7 21.1 0.4 33.3 1.1 31.9 1.3 28.7 2.9
B 12.2 37.9 22.3 18.0 38.2 14.2 40.3 18.4 31.0 7.9
C 12.0 1.8 22.7 1.5 34.0 0.9 31.3 1.5 29.3 1.5
D 12.6 6.2 23.9 2.8 34.0 2.7 34.7 8.2 29.3 4.0
E 11.9 3.4 20.9 0.7 34.0 1.2 32.4 1.3 28.7 3.7
F 7.9 73.9 25.2 20.7 41.0 17.7 40.3 24.0 38.2 13.5
G 12.1 – 21.8 – 32.3 – 30.7 – 27.3 –
0.1 A 16.1 1.0 29.9 0.5 31.5 1.3 23.6 1.7 21.7 1.2
B 17.3 7.8 32.4 3.5 33.1 7.2 27.4 6.7 21.6 13.9
C 17.2 1.1 33.3 0.2 36.5 0.7 27.4 1.2 25.1 1.4
D 17.8 3.2 33.4 0.5 36.2 2.1 26.9 1.6 22.3 3.6
E 15.6 1.1 30.0 0.5 31.4 1.5 23.5 1.7 21.2 1.8
F 14.4 11.2 31.7 6.6 36.0 7.7 35.3 8.2 27.4 6.7
G 16.3 – 29.8 – 31.3 – 23.0 – 20.6 –
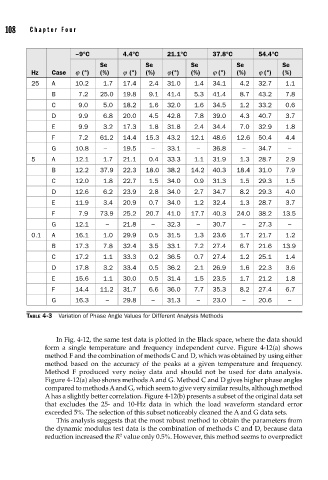
TABLE 4-3 Variation of Phase Angle Values for Different Analysis Methods
In Fig. 4-12, the same test data is plotted in the Black space, where the data should
form a single temperature and frequency independent curve. Figure 4-12(a) shows
method F and the combination of methods C and D, which was obtained by using either
method based on the accuracy of the peaks at a given temperature and frequency.
Method F produced very noisy data and should not be used for data analysis.
Figure 4-12(a) also shows methods A and G. Method C and D gives higher phase angles
compared to methods A and G, which seem to give very similar results, although method
A has a slightly better correlation. Figure 4-12(b) presents a subset of the original data set
that excludes the 25- and 10-Hz data in which the load waveform standard error
exceeded 5%. The selection of this subset noticeably cleaned the A and G data sets.
This analysis suggests that the most robust method to obtain the parameters from
the dynamic modulus test data is the combination of methods C and D, because data
2
reduction increased the R value only 0.5%. However, this method seems to overpredict