
Page 128 - MODELING OF ASPHALT CONCRETE
P. 128
106 Cha pte r F o u r
1994). Signals were filtered using second order polynomial over 25% of data, and +
marks in the signal peaks show the data points used in the modulus and phase angle
computations. The number of points included in the regression analysis was based on
the total number of points available in a cycle. The second order polynomial seems to
be an adequate representation of the waveform in the local region of the peak even
though a perfect waveform would be sinusoidal. The peak picking method has
embedded the filtering method within it. That is, the peak with no filtering (method F)
is the peak of the noise and the peak with regression filtering over less than 100% of
the data coincident with a zero in the first derivative of the regression equation
(methods C and D).
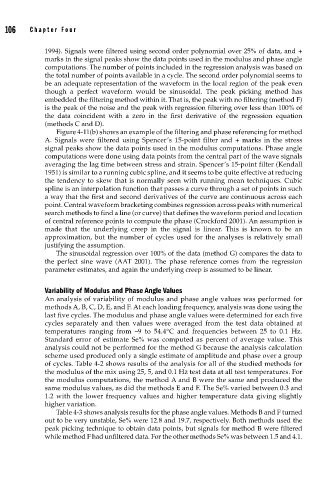
Figure 4-11(b) shows an example of the filtering and phase referencing for method
A. Signals were filtered using Spencer’s 15-point filter and + marks in the stress
signal peaks show the data points used in the modulus computations. Phase angle
computations were done using data points from the central part of the wave signals
averaging the lag time between stress and strain. Spencer’s 15-point filter (Kendall
1951) is similar to a running cubic spline, and it seems to be quite effective at reducing
the tendency to skew that is normally seen with running mean techniques. Cubic
spline is an interpolation function that passes a curve through a set of points in such
a way that the first and second derivatives of the curve are continuous across each
point. Central waveform bracketing combines regression across peaks with numerical
search methods to find a line (or curve) that defines the waveform period and location
of central reference points to compute the phase (Crockford 2001). An assumption is
made that the underlying creep in the signal is linear. This is known to be an
approximation, but the number of cycles used for the analyses is relatively small
justifying the assumption.
The sinusoidal regression over 100% of the data (method G) compares the data to
the perfect sine wave (AAT 2001). The phase reference comes from the regression
parameter estimates, and again the underlying creep is assumed to be linear.
Variability of Modulus and Phase Angle Values
An analysis of variability of modulus and phase angle values was performed for
methods A, B, C, D, E, and F. At each loading frequency, analysis was done using the
last five cycles. The modulus and phase angle values were determined for each five
cycles separately and then values were averaged from the test data obtained at
temperatures ranging from –9 to 54.4°C and frequencies between 25 to 0.1 Hz.
Standard error of estimate Se% was computed as percent of average value. This
analysis could not be performed for the method G because the analysis calculation
scheme used produced only a single estimate of amplitude and phase over a group
of cycles. Table 4-2 shows results of the analysis for all of the studied methods for
the modulus of the mix using 25, 5, and 0.1 Hz test data at all test temperatures. For
the modulus computations, the method A and B were the same and produced the
same modulus values, as did the methods E and F. The Se% varied between 0.3 and
1.2 with the lower frequency values and higher temperature data giving slightly
higher variation.
Table 4-3 shows analysis results for the phase angle values. Methods B and F turned
out to be very unstable, Se% were 12.8 and 19.7, respectively. Both methods used the
peak picking technique to obtain data points, but signals for method B were filtered
while method F had unfiltered data. For the other methods Se% was between 1.5 and 4.1.