
Page 109 - Modern Control Systems
P. 109
Section 2.6 Block Diagram Models 83
R(s) • Q • • Y(s)
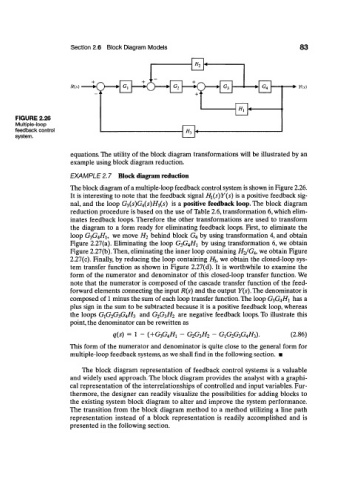
FIGURE 2.26
Multiple-loop
feedback control
system.
equations. The utility of the block diagram transformations will be illustrated by an
example using block diagram reduction.
EXAMPLE 2.7 Block diagram reduction
The block diagram of a multiple-loop feedback control system is shown in Figure 2.26.
It is interesting to note that the feedback signal Hi(s)Y(s) is a positive feedback sig-
nal, and the loop G 3(s)G 4(s)Hi(s) is a positive feedback loop. The block diagram
reduction procedure is based on the use of Table 2.6, transformation 6, which elim-
inates feedback loops. Therefore the other transformations are used to transform
the diagram to a form ready for eliminating feedback loops. First, to eliminate the
loop G3G4//1, we move H 2 behind block G 4 by using transformation 4, and obtain
Figure 2.27(a). Eliminating the loop G3G4//1 by using transformation 6, we obtain
Figure 2.27(b). Then, eliminating the inner loop containing H2/G4, we obtain Figure
2.27(c). Finally, by reducing the loop containing H 3, we obtain the closed-loop sys-
tem transfer function as shown in Figure 2.27(d). It is worthwhile to examine the
form of the numerator and denominator of this closed-loop transfer function. We
note that the numerator is composed of the cascade transfer function of the feed-
forward elements connecting the input R(s) and the output Y(s).The denominator is
composed of 1 minus the sum of each loop transfer function. The loop G3G4H1 has a
plus sign in the sum to be subtracted because it is a positive feedback loop, whereas
the loops G1G2G3G4H3 and G 2G$H 2 are negative feedback loops. To illustrate this
point, the denominator can be rewritten as
q(s) = 1 - i+G&H! - G 2G 3H 2 - G&G&Hi). (2.86)
This form of the numerator and denominator is quite close to the general form for
multiple-loop feedback systems, as we shall find in the following section. •
The block diagram representation of feedback control systems is a valuable
and widely used approach. The block diagram provides the analyst with a graphi-
cal representation of the interrelationships of controlled and input variables. Fur-
thermore, the designer can readily visualize the possibilities for adding blocks to
the existing system block diagram to alter and improve the system performance.
The transition from the block diagram method to a method utilizing a line path
representation instead of a block representation is readily accomplished and is
presented in the following section.