
Page 113 - Modern Control Systems
P. 113
Section 2.7 Signal-Flow Graph Models 87
A = 1 — (sum of all different loop gains)
+ (sum of the gain products of all combinations of two nontouching loops)
— (sum of the gain products of all combinations of three nontouching loops)
The gain formula is often used to relate the output variable Y(s) to the input
variable R(s) and is given in somewhat simplified form as
-jtfk-/
r = (2.98)
where T(s) = Y(s)/R(s).
Several examples will illustrate the utility and ease of this method. Although the
gain Equation (2.96) appears to be formidable, one must remember that it repre-
sents a summation process, not a complicated solution process.
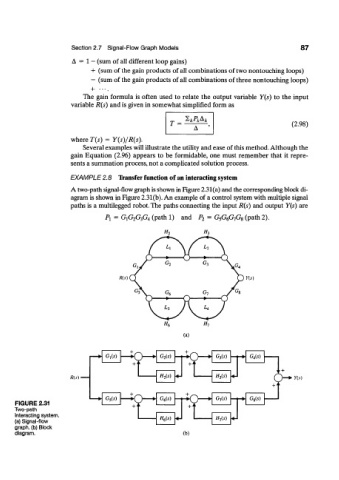
EXAMPLE 2.8 Transfer function of an interacting system
A two-path signal-flow graph is shown in Figure 2.31(a) and the corresponding block di-
agram is shown in Figure 2.31(b). An example of a control system with multiple signal
paths is a multilegged robot. The paths connecting the input R(s) and output Y(s) are
Pi = G XG 2G 3G^ (path 1) and P 2 = G 5G 6G 7G S (path 2).
«(.v)
(a)
— • G,(s) G 3{s) —•
H 3(s)
Ris) •
— • G 5(5) G 7(s) —•
FIGURE 2.31
Two-path
interacting system, H 7(s)
(a) Signal-flow H 6(s)
graph, (b) Block
diagram. (b)