Page 129 - Modern Control Systems
P. 129

Section 2.8  Design  Examples                                        103
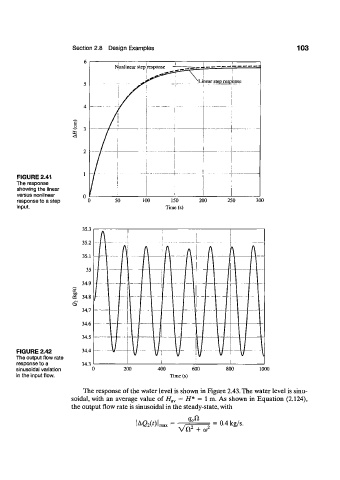


      FIGURE 2.41
      The response
      showing the linear
      versus nonlinear
      response to a step                             150
      input.                                       Time (s)


                          35.3

                          35.2
                               n       AJ    A    ' A        i         A      A
                          35.1   l__l  l_|i  LA    -L.I   / - 1 ^  LA  J_l    LA

                           35
                          34.9  J..„  J  l_.l  1—1  .L_l  I  If  j—J  h-4     - f

                          34.8
                       oi
                          34.7
                          34.6

                          34.5
      FIGURE 2.42         34.4
      The output flow rate
      response to a       34.3
      sinusoidal variation             200       400        600       800       1000
      in the input flow.                             Time (s)

                          The response  of the water level is shown in Figure 2.43. The water level is sinu-
                       soidal, with  an  average  value  of  H av  = H*  =  1  m. As  shown  in Equation  (2.124),
                       the output flow rate is sinusoidal in the steady-state, with

                                          |A£ 2(0lmax  =   2     2  =  0.4 kg/s.
                                                       Vn    +  to
   124   125   126   127   128   129   130   131   132   133   134