
Page 282 - Modern Control of DC-Based Power Systems
P. 282
Simulation 241
Figure 6.19 Duty cycle of all control methods.
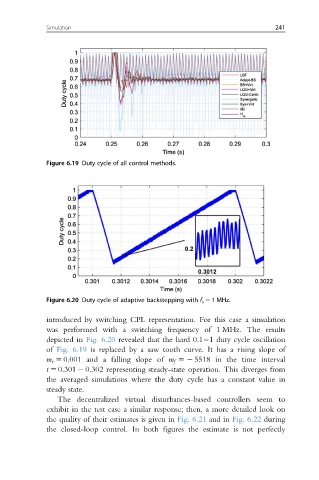
Figure 6.20 Duty cycle of adaptive backstepping with f s 5 1 MHz.
introduced by switching CPL representation. For this case a simulation
was performed with a switching frequency of 1 MHz. The results
depicted in Fig. 6.20 revealed that the hard 0.1 1 duty cycle oscillation
of Fig. 6.19 is replaced by a saw tooth curve. It has a rising slope of
m r 5 0:001 and a falling slope of m f 52 5518 in the time interval
t 5 0:301 2 0:302 representing steady-state operation. This diverges from
the averaged simulations where the duty cycle has a constant value in
steady state.
The decentralized virtual disturbances-based controllers seem to
exhibit in the test case a similar response; then, a more detailed look on
the quality of their estimates is given in Fig. 6.21 and in Fig. 6.22 during
the closed-loop control. In both figures the estimate is not perfectly