
Page 78 - Modern Control of DC-Based Power Systems
P. 78
Small-Signal Analysis of Cascaded Systems 43
Bode Plot of G vd
80
Magnitude (dB) 40
60
20
–20 0
Frequency (Hz)
0
Phase (deg) –45
–90
–135
–180
10 1 10 2 10 3 10 4
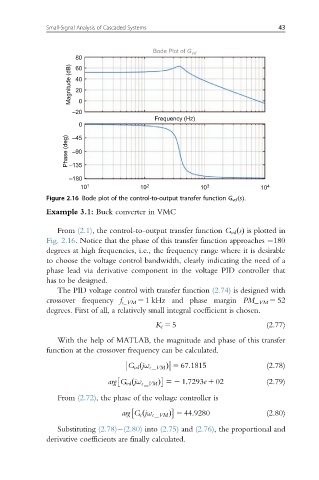
Figure 2.16 Bode plot of the control-to-output transfer function G vd s ðÞ:
Example 3.1: Buck converter in VMC
From (2.1), the control-to-output transfer function G vd ðsÞ is plotted in
Fig. 2.16. Notice that the phase of this transfer function approaches 180
degrees at high frequencies, i.e., the frequency range where it is desirable
to choose the voltage control bandwidth, clearly indicating the need of a
phase lead via derivative component in the voltage PID controller that
has to be designed.
The PID voltage control with transfer function (2.74) is designed with
crossover frequency f c_VM 5 1 kHz and phase margin PM_ VM 5 52
degrees. First of all, a relatively small integral coefficient is chosen.
K i 5 5 (2.77)
With the help of MATLAB, the magnitude and phase of this transfer
function at the crossover frequency can be calculated.
G vd ðjω c VM Þ 5 67:1815 (2.78)
arg G vd ðjω c VM Þ 52 1:7293e 1 02 (2.79)
From (2.72), the phase of the voltage controller is
arg G c ðjω c VM Þ 5 44:9280 (2.80)
Substituting (2.78) (2.80) into (2.75) and (2.76), the proportional and
derivative coefficients are finally calculated.