
Page 79 - Modern Control of DC-Based Power Systems
P. 79
44 Modern Control of DC-Based Power Systems
Bode plot of G (VM)
c
20
Magnitude (dB) –20
0
–40
–60
Frequency (Hz)
90
Phase (deg) 45 0
–45
–90
10 0 10 2 10 4 10 6
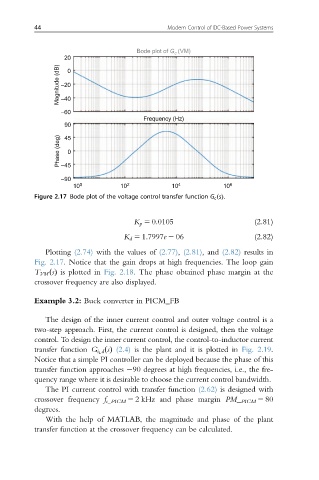
Figure 2.17 Bode plot of the voltage control transfer function G c sðÞ:
K p 5 0:0105 (2.81)
K d 5 1:7997e 2 06 (2.82)
Plotting (2.74) with the values of (2.77), (2.81), and (2.82) results in
Fig. 2.17. Notice that the gain drops at high frequencies. The loop gain
T VM ðsÞ is plotted in Fig. 2.18. The phase obtained phase margin at the
crossover frequency are also displayed.
Example 3.2: Buck converter in PICM_FB
The design of the inner current control and outer voltage control is a
two-step approach. First, the current control is designed, then the voltage
control. To design the inner current control, the control-to-inductor current
transfer function G i L d ðsÞ (2.4) is the plant and it is plotted in Fig. 2.19.
Notice that a simple PI controller can be deployed because the phase of this
transfer function approaches 90 degrees at high frequencies, i.e., the fre-
quency range where it is desirable to choose the current control bandwidth.
The PI current control with transfer function (2.62) is designed with
crossover frequency f c_PICM 5 2 kHz and phase margin PM_ PICM 5 80
degrees.
With the help of MATLAB, the magnitude and phase of the plant
transfer function at the crossover frequency can be calculated.