
Page 83 - Modern Control of DC-Based Power Systems
P. 83
48 Modern Control of DC-Based Power Systems
Bode plot of Gc V
20
Magnitude (dB) –20 0
–40
Frequency (Hz)
0
Phase (deg) –45
–90
10 0 10 1 10 2 10 3 10 4
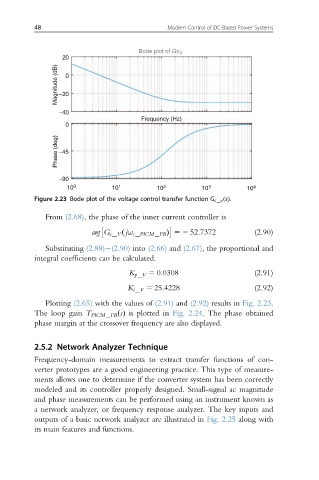
Figure 2.23 Bode plot of the voltage control transfer function G c v sðÞ:
From (2.68), the phase of the inner current controller is
arg G c V ðjω c PICM FB Þ 52 52:7372 (2.90)
Substituting (2.88) (2.90) into (2.66) and (2.67), the proportional and
integral coefficients can be calculated.
K p V 5 0:0308 (2.91)
K i V 5 25:4228 (2.92)
Plotting (2.65) with the values of (2.91) and (2.92) results in Fig. 2.23.
The loop gain T PICM FB ðsÞ is plotted in Fig. 2.24. The phase obtained
phase margin at the crossover frequency are also displayed.
2.5.2 Network Analyzer Technique
Frequency-domain measurements to extract transfer functions of con-
verter prototypes are a good engineering practice. This type of measure-
ments allows one to determine if the converter system has been correctly
modeled and its controller properly designed. Small-signal ac magnitude
and phase measurements can be performed using an instrument known as
a network analyzer, or frequency response analyzer. The key inputs and
outputs of a basic network analyzer are illustrated in Fig. 2.25 along with
its main features and functions.