
Page 84 - Modern Control of DC-Based Power Systems
P. 84
Small-Signal Analysis of Cascaded Systems 49
Bode plot of T PICM-FB
50
Magnitude (dB) –50
0
–100
Frequency (Hz)
–90
Phase (deg) –135
–180
10 1 10 2 10 3 10 4 10 5
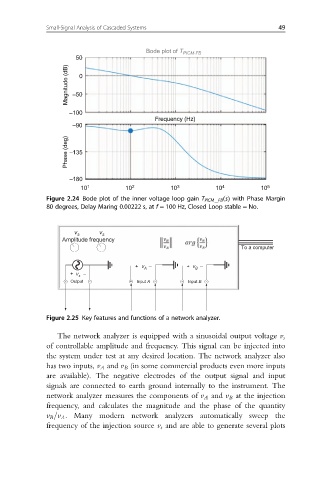
Figure 2.24 Bode plot of the inner voltage loop gain T PICM FB ðsÞ with Phase Margin
80 degrees, Delay Maring 0.00222 s, at f 5 100 Hz, Closed Loop stable 5 No.
v s v s
Amplitude frequency
To a computer
+ v A – + v B –
+ v –
s
+ Output – + Input A – + Input B –
Figure 2.25 Key features and functions of a network analyzer.
The network analyzer is equipped with a sinusoidal output voltage v s
of controllable amplitude and frequency. This signal can be injected into
the system under test at any desired location. The network analyzer also
has two inputs, v A and v B (in some commercial products even more inputs
are available). The negative electrodes of the output signal and input
signals are connected to earth ground internally to the instrument. The
network analyzer measures the components of v A and v B at the injection
frequency, and calculates the magnitude and the phase of the quantity
v B =v A . Many modern network analyzers automatically sweep the
frequency of the injection source v s and are able to generate several plots