
Page 82 - Modern Control of DC-Based Power Systems
P. 82
Small-Signal Analysis of Cascaded Systems 47
Bode plot of T PICM-FB
60
Magnitude (dB) 40
20
0
–20
Frequency (Hz)
0
Phase (deg) –45
–90
–135
10 0 10 1 10 2 10 3 10 4
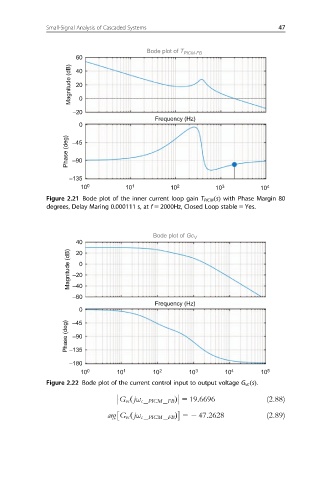
Figure 2.21 Bode plot of the inner current loop gain T PICM ðsÞ with Phase Margin 80
degrees, Delay Maring 0.000111 s, at f 5 2000Hz, Closed Loop stable 5 Yes.
Bode plot of Gc V
40
Magnitude (dB) –20
20
0
–40
–60
Frequency (Hz)
0
Phase (deg) –135
–45
–90
–180
10 0 10 1 10 2 10 3 10 4 10 5
Figure 2.22 Bode plot of the current control input to output voltage G vc sðÞ:
G vc ðjω c PICM FB Þ 5 19:6696 (2.88)
arg G vc ðjω c PICM FB Þ 52 47:2628 (2.89)