Page 80 - Modern Control of DC-Based Power Systems
P. 80

Small-Signal Analysis of Cascaded Systems                     45


                                           Bode plot of T VM
                     100
                    Magnitude (dB)  –100 0


                    –200
                                            Frequency (Hz)
                       0
                    Phase (deg)  –180
                     –90


                    –270
                       10 0          10 2          10 4          10 6
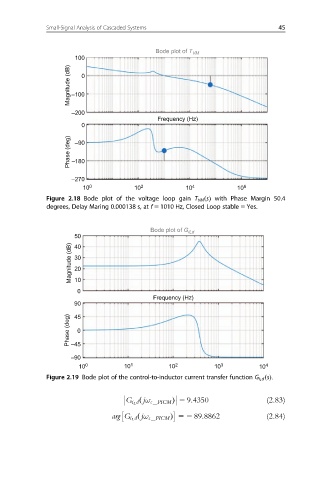
              Figure 2.18 Bode plot of the voltage loop gain T VM ðsÞ with Phase Margin 50.4
              degrees, Delay Maring 0.000138 s, at f 5 1010 Hz, Closed Loop stable 5 Yes.


                                          Bode plot of G iLd
                     50
                    Magnitude (dB)  30
                     40

                     20
                     10
                      0
                                          Frequency (Hz)
                     90
                    Phase (deg)  45 0


                    –45
                    –90
                      10 0         10 1        10 2        10 3        10 4
              Figure 2.19 Bode plot of the control-to-inductor current transfer function G i L d sðÞ:


                                    G i L d ð jω c PICM Þ 5 9:4350       (2.83)

                               arg G i L d ðjω c PICM Þ 52 89:8862       (2.84)
   75   76   77   78   79   80   81   82   83   84   85