
Page 85 - Modern Control of DC-Based Power Systems
P. 85
50 Modern Control of DC-Based Power Systems
V o
Sensing
Power stage
i L network
Network analizer
Sensed V o
Channel A
Control signal Sensed i L
Out
Channel B
Control Converted
algorithm i L , V o ADC
Controller
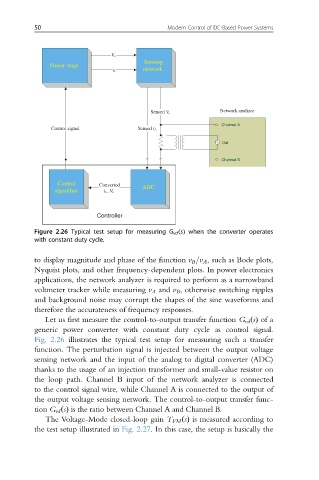
Figure 2.26 Typical test setup for measuring G vd ðsÞ when the converter operates
with constant duty cycle.
to display magnitude and phase of the function v B =v A , such as Bode plots,
Nyquist plots, and other frequency-dependent plots. In power electronics
applications, the network analyzer is required to perform as a narrowband
voltmeter tracker while measuring v A and v B , otherwise switching ripples
and background noise may corrupt the shapes of the sine waveforms and
therefore the accurateness of frequency responses.
Let us first measure the control-to-output transfer function G vd ðsÞ of a
generic power converter with constant duty cycle as control signal.
Fig. 2.26 illustrates the typical test setup for measuring such a transfer
function. The perturbation signal is injected between the output voltage
sensing network and the input of the analog to digital converter (ADC)
thanks to the usage of an injection transformer and small-value resistor on
the loop path. Channel B input of the network analyzer is connected
to the control signal wire, while Channel A is connected to the output of
the output voltage sensing network. The control-to-output transfer func-
tion G vd ðsÞ is the ratio between Channel A and Channel B.
The Voltage-Mode closed-loop gain T VM ðsÞ is measured according to
the test setup illustrated in Fig. 2.27. In this case, the setup is basically the