
Page 302 - Book Hosokawa Nanoparticle Technology Handbook
P. 302
5.2 CRYSTAL STRUCTURE FUNDAMENTALS
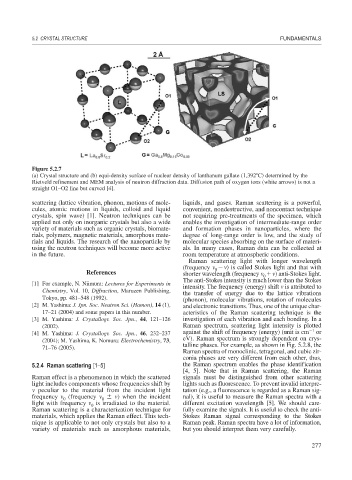
Figure 5.2.7
(a) Crystal structure and (b) equi-density surface of nuclear density of lanthanum gallate (1,392 C) determined by the
Rietveld refinement and MEM analysis of neutron diffraction data. Diffusion path of oxygen ions (white arrows) is not a
straight O1–O2 line but curved [4].
scattering (lattice vibration, phonon, motions of mole- liquids, and gases. Raman scattering is a powerful,
cules, atomic motions in liquids, colloid and liquid convenient, nondestructive, and noncontact technique
crystals, spin wave) [1]. Neutron techniques can be not requiring pre-treatments of the specimen, which
applied not only on inorganic crystals but also a wide enables the investigation of intermediate-range order
variety of materials such as organic crystals, biomate- and formation phases in nanoparticles, where the
rials, polymers, magnetic materials, amorphous mate- degree of long-range order is low, and the study of
rials and liquids. The research of the nanoparticle by molecular species absorbing on the surface of materi-
using the neutron techniques will become more active als. In many cases, Raman data can be collected at
in the future. room temperature at atmospheric conditions.
Raman scattering light with longer wavelength
(frequency ) is called Stokes light and that with
0
References shorter wavelength (frequency ) anti-Stokes light.
0
The anti-Stokes intensity is much lower than the Stokes
[1] For example, N. Niimura: Lectures for Experiments in intensity. The frequency (energy) shift is attributed to
Chemistry, Vol. 10, Diffraction, Maruzen Publishing, the transfer of energy due to the lattice vibrations
Tokyo, pp. 481–548 (1992). (phonon), molecular vibrations, rotation of molecules
[2] M. Yashima: J. Jpn. Soc. Neutron Sci. (Hamon), 14 (1), and electronic transitions. Thus, one of the unique char-
17–21 (2004) and some papers in this number. acteristics of the Raman scattering technique is the
[3] M. Yashima: J. Crystallogr. Soc. Jpn., 44, 121–126 investigation of each vibration and each bonding. In a
(2002). Raman spectrum, scattering light intensity is plotted
[4] M. Yashima: J. Crystallogr. Soc. Jpn., 46, 232–237 against the shift of frequency (energy) (unit is cm 1 or
(2004); M. Yashima, K. Nomura: Electrochemistry, 73, eV). Raman spectrum is strongly dependent on crys-
71–76 (2005). talline phases. For example, as shown in Fig. 5.2.8, the
Raman spectra of monoclinic, tetragonal, and cubic zir-
conia phases are very different from each other, thus,
5.2.4 Raman scattering [1–5] the Raman spectrum enables the phase identification
[4, 5]. Note that in Raman scattering, the Raman
Raman effect is a phenomenon in which the scattered signals must be distinguished from other scattering
light includes components whose frequencies shift by lights such as fluorescence. To prevent invalid interpre-
peculiar to the material from the incident light tation (e.g., a fluorescence is regarded as a Raman sig-
frequency (frequency ) when the incident nal), it is useful to measure the Raman spectra with a
0
0
light with frequency is irradiated to the material. different excitation wavelength [5]. We should care-
0
Raman scattering is a characterization technique for fully examine the signals. It is useful to check the anti-
materials, which applies the Raman effect. This tech- Stokes Raman signal corresponding to the Stokes
nique is applicable to not only crystals but also to a Raman peak. Raman spectra have a lot of information,
variety of materials such as amorphous materials, but you should interpret them very carefully.
277