
Page 306 - Book Hosokawa Nanoparticle Technology Handbook
P. 306
5.3 SURFACE STRUCTURE FUNDAMENTALS
photodetector detects the angle of reflection from a If the beam is focused on the cantilever through a
laser beam focused on the metal-coated top surface single-mode optical fiber, a part of beam reflects on
of cantilever. the top surface of the cantilever. At the same time, a
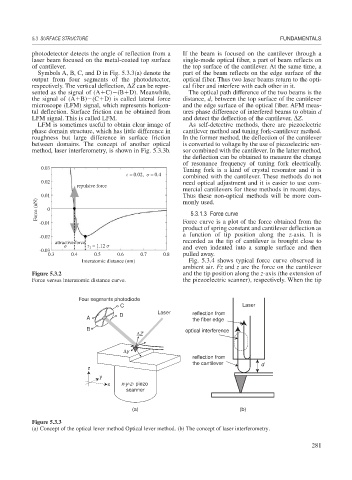
Symbols A, B, C, and D in Fig. 5.3.3(a) denote the part of the beam reflects on the edge surface of the
output from four segments of the photodetector, optical fiber. Thus two laser beams return to the opti-
respectively. The vertical deflection, Z can be repre- cal fiber and interfere with each other in it.
sented as the signal of (A C) (B D). Meanwhile, The optical path difference of the two beams is the
the signal of (A B) (C D) is called lateral force distance, d, between the top surface of the cantilever
microscope (LFM) signal, which represents horizon- and the edge surface of the optical fiber. AFM meas-
tal deflection. Surface friction can be obtained from ures phase difference of interfered beams to obtain d
LFM signal. This is called LFM. and detect the deflection of the cantilever, Z.
LFM is sometimes useful to obtain clear image of As self-detective methods, there are piezoelectric
phase domain structure, which has little difference in cantilever method and tuning fork-cantilever method.
roughness but large difference in surface friction In the former method, the deflection of the cantilever
between domains. The concept of another optical is converted to voltage by the use of piezoelectric sen-
method, laser interferometry, is shown in Fig. 5.3.3b. sor combined with the cantilever. In the latter method,
the deflection can be obtained to measure the change
of resonance frequency of tuning fork electrically.
0.03 Tuning fork is a kind of crystal resonator and it is
= 0.02, = 0.4 combined with the cantilever. These methods do not
0.02 need optical adjustment and it is easier to use com-
repulsive force
mercial cantilevers for these methods in recent days.
Thus these non-optical methods will be more com-
Force (nN) 0.01 0 monly used.
5.3.1.3 Force curve
-0.01 Force curve is a plot of the force obtained from the
product of spring constant and cantilever deflection as
a function of tip position along the z-axis. It is
-0.02
attractive force recorded as the tip of cantilever is brought close to
r 1 = 1.12 and even indented into a sample surface and then
-0.03
0.3 0.4 0.5 0.6 0.7 0.8 pulled away.
Interatomic distance (nm) Fig. 5.3.4 shows typical force curve observed in
ambient air. Fz and z are the force on the cantilever
Figure 5.3.2 and the tip position along the z-axis (the extension of
Force versus interatomic distance curve. the piezoelectric scanner), respectively. When the tip
Four segments photodiode
C Laser
Laser reflection from
D
A the fiber edge
B optical interference
ΔZ
Δy
reflection from
the cantilever d
z
y
x x-y-z- piezo
scanner
(a) (b)
Figure 5.3.3
(a) Concept of the optical lever method Optical lever method. (b) The concept of laser interferometry.
281