
Page 308 - Book Hosokawa Nanoparticle Technology Handbook
P. 308
5.3 SURFACE STRUCTURE FUNDAMENTALS
Table 5.3.2 Instruments) and noncontact mode. Small piezoelec-
Setting of scan rate in several conditions. tric device on the cantilever holder is oscillated by
applying the AC voltage and the cantilever is exter-
Scan rate nally oscillated at or close to its resonance frequency.
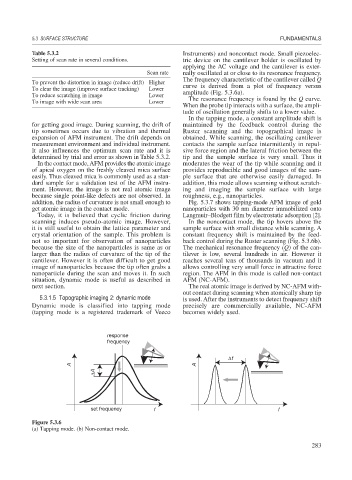
The frequency characteristic of the cantilever called Q
To prevent the distortion in image (reduce drift) Higher
To clear the image (improve surface tracking) Lower curve is derived from a plot of frequency versus
To reduce scratching in image Lower amplitude (Fig. 5.3.6a).
To image with wide scan area Lower The resonance frequency is found by the Q curve.
When the probe tip interacts with a surface, the ampli-
tude of oscillation generally shifts to a lower value.
In the tapping mode, a constant amplitude shift is
for getting good image. During scanning, the drift of maintained by the feedback control during the
tip sometimes occurs due to vibration and thermal Ruster scanning and the topographical image is
expansion of AFM instrument. The drift depends on obtained. While scanning, the oscillating cantilever
measurement environment and individual instrument. contacts the sample surface intermittently in repul-
It also influences the optimum scan rate and it is sive force region and the lateral friction between the
determined by trial and error as shown in Table 5.3.2. tip and the sample surface is very small. Thus it
In the contact mode, AFM provides the atomic image moderates the wear of the tip while scanning and it
of apical oxygen on the freshly cleaved mica surface provides reproducible and good images of the sam-
easily. Thus cleaved mica is commonly used as a stan- ple surface that are otherwise easily damaged. In
dard sample for a validation test of the AFM instru- addition, this mode allows scanning without scratch-
ment. However, the image is not real atomic image ing and imaging the sample surface with large
because single point-like defects are not observed. In roughness, e.g., nanoparticles.
addition, the radius of curvature is not small enough to Fig. 5.3.7 shows tapping-mode AFM image of gold
get atomic image in the contact mode. nanoparticles with 30 nm diameter immobilized onto
Today, it is believed that cyclic friction during Langmuir–Blodgett film by electrostatic adsorption [2].
scanning induces pseudo-atomic image. However, In the noncontact mode, the tip hovers above the
it is still useful to obtain the lattice parameter and sample surface with small distance while scanning. A
crystal orientation of the sample. This problem is constant frequency shift is maintained by the feed-
not so important for observation of nanoparticles back control during the Ruster scanning (Fig. 5.3.6b).
because the size of the nanoparticles is same as or The mechanical resonance frequency (Q) of the can-
larger than the radius of curvature of the tip of the tilever is low, several hundreds in air. However it
cantilever. However it is often difficult to get good reaches several tens of thousands in vacuum and it
image of nanoparticles because the tip often grabs a allows controlling very small force in attractive force
nanoparticle during the scan and moves it. In such region. The AFM in this mode is called non-contact
situation, dynamic mode is useful as described in AFM (NC-AFM).
next section. The real atomic image is derived by NC-AFM with-
out contact during scanning when atomically sharp tip
5.3.1.5 Topographic imaging 2: dynamic mode is used. After the instruments to detect frequency shift
Dynamic mode is classified into tapping mode precisely are commercially available, NC-AFM
(tapping mode is a registered trademark of Veeco becomes widely used.
response
frequency
Δf
A A
ΔA
set frequency f f
Figure 5.3.6
(a) Tapping mode. (b) Non-contact mode.
283