
Page 313 - Book Hosokawa Nanoparticle Technology Handbook
P. 313
FUNDAMENTALS CH. 5 CHARACTERIZATION METHODS FOR NANOSTRUCTURE OF MATERIALS
a Michelson interferometer and the obtained interfer- The K–M function is proportional to the sample
ence signals are subjected to Fourier transformation. concentration if the absorptive power of the sample is
low and the scattering coefficient is constant for all
5.3.3.2 Observation of the powder surface particles constituting the sample. Because the K–M
If light is applied to a powder sample, complex opti- function can also be affected by the particle size,
cal paths will be generated by transmission, scatter- shape, filling structure, and so on, these parameters
ing, reflection, and so on. With this in mind, the need to be kept constant when this function is used for
method of measurement needs to be changed depend- quantitative analysis. However, concerning the nano-
ing on which of these optical paths is to be utilized sized particles, it is difficult to keep these parameters
and addressed, and transmission and diffuse reflection constant in a highly reproducible manner, and particu-
methods are often used for this purpose. lar care is needed when the peaks are compared. Other
With the transmission method, the light transmitted methods available include reflection absorption spec-
through a disk-shaped sample is measured with the troscopy, photoacoustic spectroscopy, and so on [3].
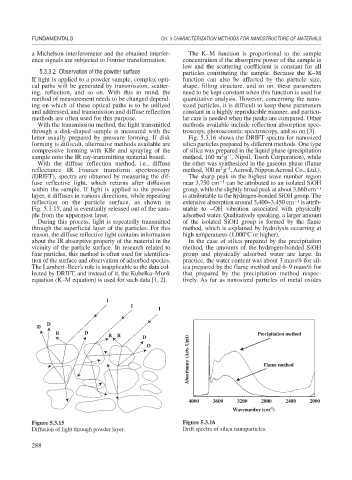
latter usually prepared by pressure forming. If disk Fig. 5.3.16 shows the DRIFT spectra for nanosized
forming is difficult, alternative methods available are silica particles prepared by different methods. One type
compressive forming with KBr and spraying of the of silica was prepared in the liquid phase (precipitation
2 –1
sample onto the IR ray-transmitting material board. method, 160 m g , Nipsil, Tosoh Corporation), while
With the diffuse reflection method, i.e., diffuse the other was synthesized in the gaseous phase (flame
2 –1
reflectance IR Fourier transform spectroscopy method, 300 m g , Aerosil, Nippon Aerosil Co., Ltd.).
(DRIFT), spectra are obtained by measuring the dif- The sharp peak in the highest wave number region
fuse reflective light, which returns after diffusion near 3,750 cm 1 can be attributed to an isolated SiOH
within the sample. If light is applied to the powder group, while the slightly broad peak at about 3,660 cm 1
layer, it diffuses in various directions, while repeating is attributable to the hydrogen-bonded SiOH group. The
reflection on the particle surface, as shown in extensive absorption around 3,400–3,450 cm 1 is attrib-
Fig. 5.3.15, and is eventually released out of the sam- utable to –OH vibration associated with physically
ple from the uppermost layer. adsorbed water. Qualitatively speaking, a larger amount
During this process, light is repeatedly transmitted of the isolated SiOH group is formed by the flame
through the superficial layer of the particles. For this method, which is explained by hydrolysis occurring at
reason, the diffuse reflective light contains information high temperatures (1,000 C or higher).
about the IR absorptive property of the material in the In the case of silica prepared by the precipitation
vicinity of the particle surface. In research related to method, the amounts of the hydrogen-bonded SiOH
fine particles, this method is often used for identifica- group and physically adsorbed water are large. In
tion of the surface and observation of adsorbed species. practice, the water content was about 3 mass% for sil-
The Lambert–Beer’s rule is inapplicable to the data col- ica prepared by the flame method and 6–9 mass% for
lected by DRIFT, and instead of it, the Kubelka–Munk that prepared by the precipitation method respec-
equation (K–M equation) is used for such data [1, 2]. tively. As far as nanosized particles of metal oxides
I
I
I
D
D
R D Precipitation method
R R D
Absorbance (Arb. Unit) Flame method
O
4000 3600 3200 2800 2400 2000
-1
Wavenumber (cm )
Figure 5.3.15 Figure 5.3.16
Diffusion of light through powder layer. Drift spectra of silica nanoparticles.
288