
Page 312 - Book Hosokawa Nanoparticle Technology Handbook
P. 312
5.3 SURFACE STRUCTURE FUNDAMENTALS
5.3.3 FT-IR
IR spectroscopy and Raman spectroscopy, both
designed to measure vibration spectra, yield informa-
tion pertaining to chemical bonds. These analytical
methods allow the measurement of substances in any
state (gas, liquid, or solid), with only a small amount
of sample required and minimal interference from
coexisting substances. Moreover, the process is swift,
involving simple manipulations. These advantages
mean the techniques have been widely used in various
fields of research related to materials, environments,
organisms, and so on.
IR absorption takes place when bipolar molecu-
lar moments are altered by molecular vibration,
while Raman scatter is seen when the polarization
rate of molecules change (Raman activity).
Generally, IR and Raman spectroscopies make up
for the shortcomings of the other. This section will
focus on IR spectroscopy and briefly detail its
method as well as how to apply it to surface analy-
sis. Details of the principles and features of IR
spectroscopy have been described in numerous
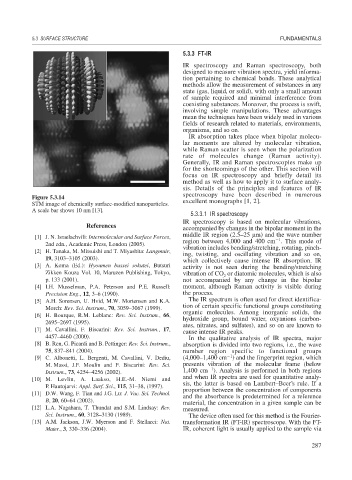
Figure 5.3.14
STM image of chemically surface-modified nanoparticles. excellent monographs [1, 2].
A scale bar shows 10 nm [13].
5.3.3.1 IR spectroscopy
IR spectroscopy is based on molecular vibrations,
References
accompanied by changes in the bipolar moment in the
middle IR region (2.5–25 m) and the wave number
[1] J. N. Israelachvili: Intermolecular and Surface Forces,
1
region between 4,000 and 400 cm . This mode of
2nd edn., Academic Press, London (2005).
vibration includes bending/stretching, rotating, pinch-
[2] H. Tanaka, M. Mitsuishi and T. Miyashita: Langmuir,
ing, twisting, and oscillating vibration and so on,
19, 3103–3105 (2003).
which collectively cause intense IR absorption. IR
[3] A. Koma (Ed.): Hyoumen bussei sokutei, Butsuri activity is not seen during the bending/stretching
Zikken Kouza Vol. 10, Maruzen Publishing, Tokyo, vibration of CO or diatomic molecules, which is also
2
p. 133 (2001). not accompanied by any change in the bipolar
[4] I.H. Musselman, P.A. Peterson and P.E. Russell: moment, although Raman activity is visible during
Precision Eng., 12, 3–6 (1990). the process.
[5] A.H. Sorensen, U. Hvid, M.W. Mortensen and K.A. The IR spectrum is often used for direct identifica-
tion of certain specific functional groups constituting
Morch: Rev. Sci. Instrum., 70, 3059–3067 (1999).
organic molecules. Among inorganic solids, the
[6] H. Bourque, R.M. Leblanc: Rev. Sci. Instrum., 66,
hydroxide group, bound water, oxyanions (carbon-
2695–2697 (1995).
ates, nitrates, and sulfates), and so on are known to
[7] M. Cavallini, F. Biscarini: Rev. Sci. Instrum., 17,
cause intense IR peaks.
4457–4460 (2000). In the qualitative analysis of IR spectra, major
[8] B. Ren, G. Picardi and B. Pettinger: Rev. Sci. Instrum., absorption is divided into two regions, i.e., the wave
75, 837–841 (2004). number region specific to functional groups
1
[9] C. Albonetti, L. Bergenti, M. Cavallini, V. Dediu, (4,000–1,400 cm ) and the fingerprint region, which
M. Massi, J.F. Moulin and F. Biscarini: Rev. Sci. presents vibration of the molecular frame (below
1
Instrum., 73, 4254–4256 (2002). 1,400 cm ). Analysis is performed in both regions
and when IR spectra are used for quantitative analy-
[10] M. Levlin, A. Laakso, H.E.-M. Niemi and
sis, the latter is based on Lambert–Beer’s rule. If a
P. Hautojarvi: Appl. Surf. Sci., 115, 31–38, (1997).
proportion between the concentration of components
[11] D.W. Wang, F. Tian and J.G. Lu: J. Vac. Sci. Technol.
and the absorbance is predetermined for a reference
B, 20, 60–64 (2002).
material, the concentration in a given sample can be
[12] L.A. Nagahara, T. Thundat and S.M. Lindsay: Rev. measured.
Sci. Instrum., 60, 3128–3130 (1989). The device often used for this method is the Fourier-
[13] A.M. Jackson, J.W. Myerson and F. Stellacci: Nat. transformation IR (FT-IR) spectroscope. With the FT-
Mater., 3, 330–336 (2004). IR, coherent light is usually applied to the sample via
287