
Page 315 - Book Hosokawa Nanoparticle Technology Handbook
P. 315
FUNDAMENTALS CH. 5 CHARACTERIZATION METHODS FOR NANOSTRUCTURE OF MATERIALS
d p (which was particularly sharp at a wave number of resulting in the rapid formation of oxygen radicals
1,500 cm 1 or less). and relatively effective oxidation of organic sub-
The conventional ATR method was based on multi- stances. In this way, the organic contaminants on the
ple total reflection. This method involved the sample solid surface are oxidized by UV rays and eventually
being kept in close contact with the surface of a prism degrade into CO and H O, which are eliminated from
2
2
made of a material with high refractive potential, and the surface by means of evaporation.
measured by light having undergone multiple reflec-
tions on the prism–sample interface. In recent years,
the prism-fixed horizontal type ATR method, which References
involves compression of the sample placed horizon-
tally on the prism from the upper direction (single- [1] J. Hiraishi, S. Minami, K. Masutani, S. Kondo,
reflection ATR), has been developed and for reasons K. Ishitani: Fourier Transform Infrared Spectrometry,
of convenience, this new ATR method has replaced Japan Scientific Societies Press, Tokyo (1982).
the conventional method. [2] M. Tasumi: Fundamentals and Practice of FT-IR,
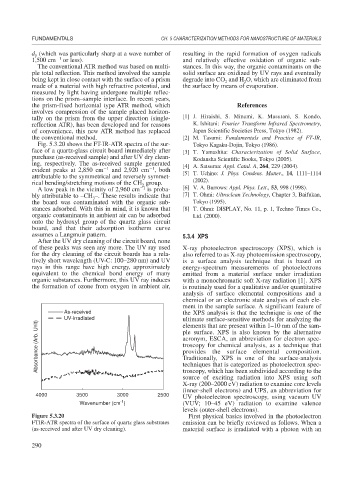
Fig. 5.3.20 shows the FT-IR-ATR spectra of the sur- Tokyo Kagaku-Dojin, Tokyo (1986).
face of a quartz-glass circuit board immediately after [3] T. Yamashita: Characterization of Solid Surface,
purchase (as-received sample) and after UV dry clean- Kodansha Scientific Books, Tokyo (2005).
ing, respectively. The as-received sample generated [4] A. Satsuma: Appl. Catal. A, 264, 229 (2004).
1
evident peaks at 2,850 cm 1 and 2,920 cm , both [5] T. Uchino: J. Phys. Condens. Matter., 14, 1111–1114
attributable to the symmetrical and reversely symmet-
rical bending/stretching motions of the CH group. (2002).
2
A low peak in the vicinity of 2,960 cm 1 is proba- [6] V. A. Burrows: Appl. Phys. Lett., 53, 998 (1998).
bly attributable to –CH –. These results indicate that [7] T. Ohmi: Ultraclean Technology, Chapter 3, Baifukan,
3
the board was contaminated with the organic sub- Tokyo (1995).
stances adsorbed. With this in mind, it is known that [8] T. Ohmi: DISPLAY, No. 11, p. 1, Techno Times Co.,
organic contaminants in ambient air can be adsorbed Ltd. (2000).
onto the hydroxyl group of the quartz glass circuit
board, and that their adsorption isotherm curve
assumes a Langmuir pattern. 5.3.4 XPS
After the UV dry cleaning of the circuit board, none
of these peaks was seen any more. The UV ray used X-ray photoelectron spectroscopy (XPS), which is
for the dry cleaning of the circuit boards has a rela- also referred to as X-ray photoemission spectroscopy,
tively short wavelength (UV-C: 100–280 nm) and UV is a surface analysis technique that is based on
rays in this range have high energy, approximately energy-spectrum measurements of photoelectrons
equivalent to the chemical bond energy of many emitted from a material surface under irradiation
organic substances. Furthermore, this UV ray induces with a monochromatic soft X-ray radiation [1]. XPS
the formation of ozone from oxygen in ambient air, is routinely used for a qualitative and/or quantitative
analysis of surface elemental compositions and a
chemical or an electronic state analysis of each ele-
ment in the sample surface. A significant feature of
As-received the XPS analysis is that the technique is one of the
UV-irradiated ultimate surface-sensitive methods for analyzing the
Absorbance (Arb. Unit) ple surface. XPS is also known by the alternative
elements that are present within 1–10 nm of the sam-
acronym, ESCA, an abbreviation for electron spec-
troscopy for chemical analysis, as a technique that
provides the surface elemental composition.
Traditionally, XPS is one of the surface-analysis
techniques that is categorized as photoelectron spec-
troscopy, which has been subdivided according to the
source of exciting radiation into XPS using soft
X-ray (200–2000 eV) radiation to examine core levels
(inner-shell electrons) and UPS, an abbreviation for
4000 3500 3000 2500
UV photoelectron spectroscopy, using vacuum UV
-1
Wavenumber (cm ) (VUV; 10–45 eV) radiation to examine valence
levels (outer-shell electrons).
Figure 5.3.20 First physical basics involved in the photoelectron
FTIR-ATR spectra of the surface of quartz glass substrates emission can be briefly reviewed as follows. When a
(as-received and after UV dry cleaning). material surface is irradiated with a photon with an
290