
Page 314 - Book Hosokawa Nanoparticle Technology Handbook
P. 314
5.3 SURFACE STRUCTURE FUNDAMENTALS
the concept of the ATR method. The depth of pene-
tration (d ) is defined by the following equation:
p
Absorbance (Arb. Unit) Before heat d 2 4 ⎧ sin 2 ⎛ ⎜ ⎝ n ⎞ ⎪ ⎫ ⎪ ⎭ (5.3.5)
1/2
2
⎪
10
2
⎟ ⎬
⎨
p
n ⎠
n
1 ⎪
⎩
1
treatment
In this equation, v, n , n 2, and denote the wave num-
After heat
1
ber, refractive index of the ATR prism, that of the
treatment
sample, and the incident angle, respectively.
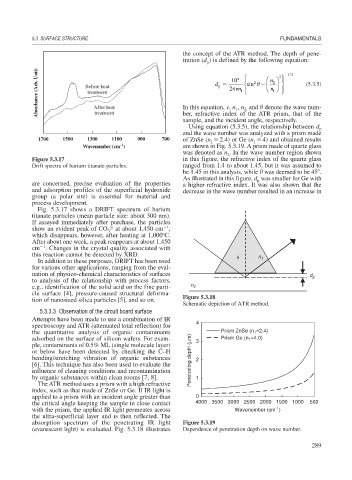
Using equation (5.3.5), the relationship between d p
and the wave number was analyzed with a prism made
1700 1500 1300 1100 900 700 of ZnSe (n 2.4) or Ge (n 4) and obtained results
1
1
-1
Wavenumber (cm ) are shown in Fig. 5.3.19. A prism made of quartz glass
was denoted as n . In the wave number region shown
2
Figure 5.3.17 in this figure, the refractive index of the quartz glass
Drift spectra of barium titanate particles. ranged from 1.4 to about 1.45, but it was assumed to
be 1.45 in this analysis, while was deemed to be 45 .
As illustrated in this figure, d was smaller for Ge with
p
are concerned, precise evaluation of the properties a higher refractive index. It was also shown that the
and adsorption profiles of the superficial hydroxide decrease in the wave number resulted in an increase in
group (a polar site) is essential for material and
process development.
Fig. 5.3.17 shows a DRIFT spectrum of barium
titanate particles (mean particle size: about 300 nm).
If assayed immediately after purchase, the particles
1
show an evident peak of CO 3 2! at about 1,450 cm ,
o
which disappears, however, after heating at 1,000 C.
After about one week, a peak reappears at about 1,450
1
cm . Changes in the crystal quality associated with
this reaction cannot be detected by XRD. n 1
In addition to these purposes, DRIFT has been used
for various other applications, ranging from the eval-
uation of physico-chemical characteristics of surfaces d p
to analysis of the relationship with process factors,
e.g., identification of the solid acid on the fine parti- n 2
cle surface [4], pressure-caused structural deforma-
tion of nanosized silica particles [5], and so on. Figure 5.3.18
Schematic depiction of ATR method.
5.3.3.3 Observation of the circuit board surface
Attempts have been made to use a combination of IR 4
spectroscopy and ATR (attenuated total reflection) for
the quantitative analysis of organic contaminants Prism ZnSe (n =2.4)
1
adsorbed on the surface of silicon wafers. For exam- 3 Prism Ge (n =4.0)
1
ple, contaminants of 0.5% ML (single molecule layer)
or below have been detected by checking the C–H
bending/stretching vibration of organic substances Penetrating depth (μm) 2
[6]. This technique has also been used to evaluate the
influence of cleaning conditions and recontamination
by organic substances within clean rooms [7, 8]. 1
The ATR method uses a prism with a high refractive
index, such as that made of ZnSe or Ge. If IR light is
applied to a prism with an incident angle greater than 0
the critical angle keeping the sample in close contact 4000 3500 3000 2500 2000 1500 1000 500
-1
with the prism, the applied IR light permeates across Wavenumber (cm )
the ultra-superficial layer and is then reflected. The
absorption spectrum of the penetrating IR light Figure 5.3.19
(evanescent light) is evaluated. Fig. 5.3.18 illustrates Dependence of penetration depth on wave number.
289