
Page 324 - Book Hosokawa Nanoparticle Technology Handbook
P. 324
5.4 NANOPORE CHARACTERIZATION FUNDAMENTALS
may not be suitable for strict PSD analysis especially for able to estimate pore width because the t value at the
pores with larger size or wider distribution. point should be equal to half of the pore width.
However, since this principle neglects the effect of
5.4.2.3 Pore size estimation based on standard potential overlap, which becomes more significant for
isotherms smaller pores, the accuracy becomes low for smaller
Standard isotherm is the one measured on a non- pores. Another point to be noted here is that the t-plot
porous solid with the same chemical composition as for mesoporous body exhibits upward shift form lin-
that of porous material in question, which in general earity in higher pressure range, which results from
exhibit Type II of BDDT classification. Converting occurrence of capillary condensation.
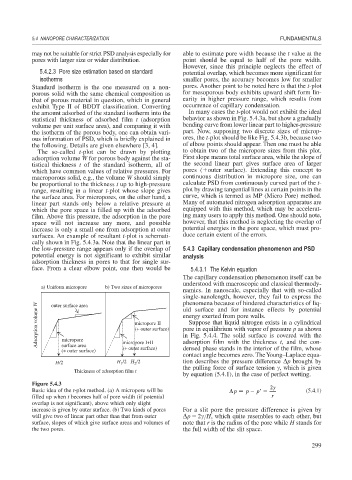
the amount adsorbed of the standard isotherm into the In many cases the t-plot would not exhibit the ideal
statistical thickness of adsorbed film t (adsorption behavior as shown in Fig. 5.4.3a, but show a gradually
volume per unit surface area), and comparing it with bending curve from lower linear part to higher-pressure
the isotherm of the porous body, one can obtain vari- part. Now, supposing two discrete sizes of microp-
ous information of PSD, which is briefly explained in ores, the t-plot should be like Fig. 5.4.3b, because two
the following. Details are given elsewhere [3, 4]. of elbow points should appear. Then one must be able
The so-called t-plot can be drawn by plotting to obtain two of the micropore sizes from this plot.
adsorption volume W for porous body against the sta- First slope means total surface area, while the slope of
tistical thickness t of the standard isotherm, all of the second linear part gives surface area of larger
which have common values of relative pressures. For pores ( outer surface). Extending this concept to
macroporous solid, e.g., the volume W should simply continuous distribution in micropore size, one can
be proportional to the thickness t up to high-pressure calculate PSD from continuously curved part of the t-
range, resulting in a linear t-plot whose slope gives plot by drawing tangential lines at certain points in the
the surface area. For micropores, on the other hand, a curve, which is termed as MP (Micro Pore) method.
linear part stands only below a relative pressure at Many of automated nitrogen adsorption apparatus are
which the pore space is filled up with the adsorbed equipped with this method, which may be accelerat-
film. Above this pressure, the adsorption in the pore ing many users to apply this method. One should note,
space will not increase any more, and possible however, that this method is neglecting the overlap of
increase is only a small one from adsorption at outer potential energies in the pore space, which must pro-
surfaces. An example of resultant t-plot is schemati- duce certain extent of the errors.
cally shown in Fig. 5.4.3a. Note that the linear part in
the low-pressure range appears only if the overlap of 5.4.3 Capillary condensation phenomenon and PSD
potential energy is not significant to exhibit similar analysis
adsorption thickness in pores to that for single sur-
face. From a clear elbow point, one then would be 5.4.3.1 The Kelvin equation
The capillary condensation phenomenon itself can be
understood with macroscopic and classical thermody-
a) Uniform micropore b) Two sizes of micropores
namics. In nanoscale, especially that with so-called
single-nanolength, however, they fail to express the
phenomena because of hindered characteristics of liq-
Adsorption volume W micropore II energy exerted from pore walls.
outer surface area
uid surface and for instance effects by potential
Suppose that liquid nitrogen exists in a cylindrical
pore in equilibrium with vapor of pressure p as shown
(+ outer surface)
in Fig. 5.4.4. The solid surface is covered with the
micropore
surface area
densed phase stands in the interior of the film, whose
(+ outer surface)
(+ outer surface) micropore I+II adsorption film with the thickness t, and the con-
contact angle becomes zero. The Young–Laplace equa-
H/2 H /2 H /2 tion describes the pressure difference p brought by
2
1
the pulling force of surface tension , which is given
Thickness of adsorption film t
by equation (5.4.1), in the case of perfect wetting.
Figure 5.4.3 2
Basic idea of the t-plot method. (a) A micropore will be p
p ′ (5.4.1)
p
filled up when t becomes half of pore width (if potential r
overlap is not significant), above which only slight
increase is given by outer surface. (b) Two kinds of pores For a slit pore the pressure difference is given by
will give two of linear part other than that from outer p 2 H, which quite resembles to each other, but
surface, slopes of which give surface areas and volumes of note that r is the radius of the pore while H stands for
the two pores. the full width of the slit space.
299