
Page 253 - Numerical Analysis Using MATLAB and Excel
P. 253
Chapter 6 Fourier, Taylor, and Maclaurin Series
1.2
K=5
1
0.8
0.6
0.4
0.2
0
-0.2
-0.4
-4 -3 -2 -1 0 1 2 3 4
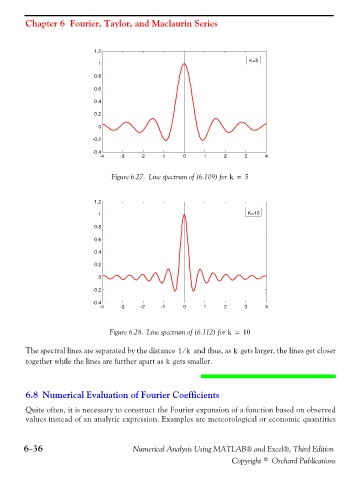
Figure 6.27. Line spectrum of (6.109) for k = 5
1.2
K=10
1
0.8
0.6
0.4
0.2
0
-0.2
-0.4
-4 -3 -2 -1 0 1 2 3 4
Figure 6.28. Line spectrum of (6.112) for k = 10
The spectral lines are separated by the distance 1k⁄ and thus, as gets larger, the lines get closer
k
together while the lines are further apart as gets smaller.
k
6.8 Numerical Evaluation of Fourier Coefficients
Quite often, it is necessary to construct the Fourier expansion of a function based on observed
values instead of an analytic expression. Examples are meteorological or economic quantities
6−36 Numerical Analysis Using MATLAB® and Excel®, Third Edition
Copyright © Orchard Publications