
Page 69 - Numerical Analysis Using MATLAB and Excel
P. 69
Chapter 2 Root Approximations
x f(x)
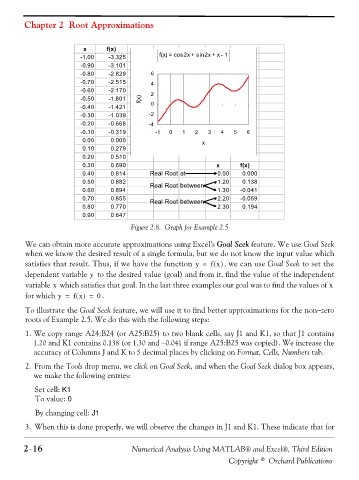
-1.00 -3.325 f(x) = cos2x + sin2x + x - 1
-0.90 -3.101
-0.80 -2.829 6
-0.70 -2.515 4
-0.60 -2.170 2
-0.50 -1.801 f(x)
-0.40 -1.421 0
-0.30 -1.039 -2
-0.20 -0.668 -4
-0.10 -0.319 -1 0 1 2 3 4 5 6
0.00 0.000 x
0.10 0.279
0.20 0.510
0.30 0.690 x f(x)
0.40 0.814 Real Root at 0.00 0.000
0.50 0.882 Real Root between 1.20 0.138
0.60 0.894 1.30 -0.041
0.70 0.855 Real Root between 2.20 -0.059
0.80 0.770 2.30 0.194
0.90 0.647
Figure 2.8. Graph for Example 2.5
We can obtain more accurate approximations using Excel’s Goal Seek feature. We use Goal Seek
when we know the desired result of a single formula, but we do not know the input value which
satisfies that result. Thus, if we have the function y = f x() , we can use Goal Seek to set the
dependent variable to the desired value (goal) and from it, find the value of the independent
y
x
variable which satisfies that goal. In the last three examples our goal was to find the values of x
for which y = f x() = . 0
To illustrate the Goal Seek feature, we will use it to find better approximations for the non−zero
roots of Example 2.5. We do this with the following steps:
1. We copy range A24:B24 (or A25:B25) to two blank cells, say J1 and K1, so that J1 contains
1.20 and K1 contains 0.138 (or 1.30 and −0.041 if range A25:B25 was copied). We increase the
accuracy of Columns J and K to 5 decimal places by clicking on Format, Cells, Numbers tab.
2. From the Tools drop menu, we click on Goal Seek, and when the Goal Seek dialog box appears,
we make the following entries:
Set cell: K1
To value: 0
By changing cell: J1
3. When this is done properly, we will observe the changes in J1 and K1. These indicate that for
2−16 Numerical Analysis Using MATLAB® and Excel®, Third Edition
Copyright © Orchard Publications