
Page 62 - Optofluidics Fundamentals, Devices, and Applications
P. 62
Cladding fluid Light output/
inlets transparent
window
B
C
Optical fiber
inserted manually Fluid outlet
Core fluid inlet
300 μm
(a)
200 μm
75 μm 100 μm
125 μm 300 μm
200 μm
100 μm
Inlet side Outlet side
(b) (c)
100 μm
100 μm
10 (0.135) core 20 (0.063) core 50 (0.015) core
2.5 (0.12) clad 6.5 (0.06) clad 50 (0.022) clad
(d) (e) (f)
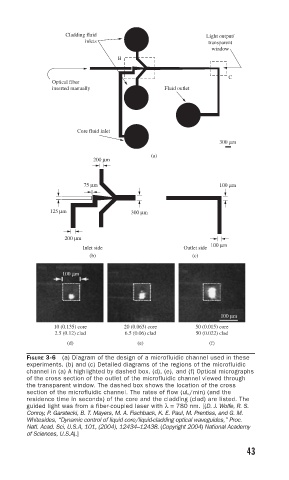
FIGURE 3-6 (a) Diagram of the design of a microfluidic channel used in these
experiments. (b) and (c) Detailed diagrams of the regions of the microfluidic
channel in (a) A highlighted by dashed box. (d), (e), and (f) Optical micrographs
of the cross section of the outlet of the microfluidic channel viewed through
the transparent window. The dashed box shows the location of the cross
section of the microfluidic channel. The rates of flow (uL/min) (and the
residence time in seconds) of the core and the cladding (clad) are listed. The
guided light was from a fiber-coupled laser with λ= 780 nm. [(D. J. Wolfe, R. S.
Conroy, P. Garstecki, B. T. Mayers, M. A. Fischback, K. E. Paul, M. Prentiss, and G. M.
Whitesides, “Dynamic control of liquid core/liquid-cladding optical waveguides,” Proc.
Natl. Acad. Sci, U.S.A, 101, (2004), 12434–12438. (Copyright 2004) National Academy
of Sciences, U.S.A).]
43