
Page 63 - Optofluidics Fundamentals, Devices, and Applications
P. 63
44 Cha pte r T h ree
This unfavorable effect can be partially circumvented, however, by
using a higher rate of flow as mentioned in the previous section.
2
The loss in the intensity of guided light in L waveguides is around
0.1 dB/cm. The efficiency of coupling light from the L waveguide into
2
a multimode optical fiber (step-index fiber, numerical aperture = 0.22,
core diameter = 105 μm, cladding diameter = 125 μm) is ~ 40%. Light
2
exiting the L waveguide remains polarized in the input direction to
~ 100:1; this ratio is indistinguishable from the light in the input fiber.
2
Complex Devices Derived from L Waveguides
Based on the L waveguide configuration, we have developed other
2
functional optical devices in microfluidic systems (Fig. 3-7).
(i) Flow direction (iv)
300 μm 150 μm 150 μm
(v)
(ii)
(iii) (vi)
(a) 300 μm
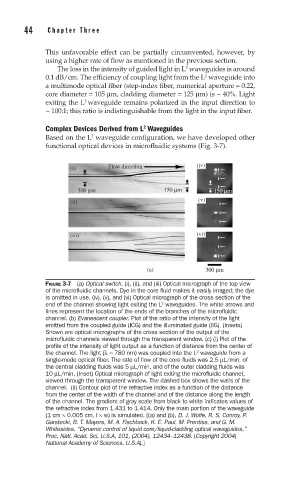
FIGURE 3-7 (a) Optical switch. (i), (ii), and (iii) Optical micrograph of the top view
of the microfl uidic channels. Dye in the core fl uid makes it easily imaged; the dye
is omitted in use. (iv), (v), and (vi) Optical micrograph of the cross section of the
end of the channel showing light exiting the L waveguides. The white arrows and
2
lines represent the location of the ends of the branches of the microfl uidic
channel. (b) Evanescent coupler. Plot of the ratio of the intensity of the light
emitted from the coupled guide (ICG) and the illuminated guide (IIG). (Insets)
Shown are optical micrographs of the cross section of the output of the
microfl uidic channels viewed through the transparent window. (c) (i) Plot of the
profi le of the intensity of light output as a function of distance from the center of
2
the channel. The light (λ= 780 nm) was coupled into the L waveguide from a
single-mode optical fi ber. The rate of fl ow of the core fl uids was 2.5 μL/min, of
the central cladding fl uids was 5 μL/min, and of the outer cladding fl uids was
10 μL/min. (Inset) Optical micrograph of light exiting the microfl uidic channel,
viewed through the transparent window. The dashed box shows the walls of the
channel. (ii) Contour plot of the refractive index as a function of the distance
from the center of the width of the channel and of the distance along the length
of the channel. The gradient of gray scale from black to white indicates values of
the refractive index from 1.431 to 1.414. Only the main portion of the waveguide
(1 cm × 0.005 cm, l × w) is simulated. [(a) and (b), D. J. Wolfe, R. S. Conroy, P.
Garstecki, B. T. Mayers, M. A. Fischback, K. E. Paul, M. Prentiss, and G. M.
Whitesides, “Dynamic control of liquid core/liquid-cladding optical waveguides,”
Proc. Natl. Acad. Sci, U.S.A, 101, (2004), 12434–12438. (Copyright 2004)
National Academy of Sciences, U.S.A).]