
Page 68 - Optofluidics Fundamentals, Devices, and Applications
P. 68
Optical Components Based on Dynamic Liquid-Liquid Interfaces 49
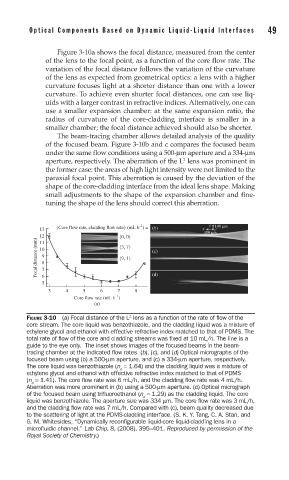
Figure 3-10a shows the focal distance, measured from the center
of the lens to the focal point, as a function of the core flow rate. The
variation of the focal distance follows the variation of the curvature
of the lens as expected from geometrical optics: a lens with a higher
curvature focuses light at a shorter distance than one with a lower
curvature. To achieve even shorter focal distances, one can use liq-
uids with a larger contrast in refractive indices. Alternatively, one can
use a smaller expansion chamber: at the same expansion ratio, the
radius of curvature of the core-cladding interface is smaller in a
smaller chamber; the focal distance achieved should also be shorter.
The beam-tracing chamber allows detailed analysis of the quality
of the focused beam. Figure 3-10b and c compares the focused beam
under the same flow conditions using a 500-μm aperture and a 334-μm
2
aperture, respectively. The aberration of the L lens was prominent in
the former case: the areas of high light intensity were not limited to the
paraxial focal point. This aberration is caused by the deviation of the
shape of the core-cladding interface from the ideal lens shape. Making
small adjustments to the shape of the expansion chamber and fine-
tuning the shape of the lens should correct this aberration.
–1 y 100 μm
13 {Core flow rate, cladding flow rate} (mL h ) = (b) x z′
400 μm
12 {0, 0}
Focal distance (mm) 10 9 8 7 {3, 7} (c)
11
{9, 1}
5 6 (d)
3 4 5 6 7 8
–1
Core flow rate (mL h )
(a)
2
FIGURE 3-10 (a) Focal distance of the L lens as a function of the rate of fl ow of the
core stream. The core liquid was benzothiazole, and the cladding liquid was a mixture of
ethylene glycol and ethanol with effective refractive index matched to that of PDMS. The
total rate of fl ow of the core and cladding streams was fi xed at 10 mL/h. The line is a
guide to the eye only. The inset shows images of the focused beams in the beam-
tracing chamber at the indicated fl ow rates. (b), (c), and (d) Optical micrographs of the
focused beam using (b) a 500-μm aperture, and (c) a 334-μm aperture, respectively.
The core liquid was benzothiazole (n = 1.64) and the cladding liquid was a mixture of
d
ethylene glycol and ethanol with effective refractive index matched to that of PDMS
(n = 1.41). The core fl ow rate was 6 mL/h, and the cladding fl ow rate was 4 mL/h.
d
Aberration was more prominent in (b) using a 500-μm aperture. (d) Optical micrograph
of the focused beam using trifl uoroethanol (n = 1.29) as the cladding liquid. The core
d
liquid was benzothiazole. The aperture size was 334 μm. The core fl ow rate was 3 mL/h,
and the cladding fl ow rate was 7 mL/h. Compared with (c), beam quality decreased due
to the scattering of light at the PDMS-cladding interface. (S. K. Y. Tang, C. A. Stan, and
G. M. Whitesides, “Dynamically reconfigurable liquid-core liquid-cladding lens in a
microfluidic channel,” Lab Chip, 8, (2008), 395–401. Reproduced by permission of the
Royal Society of Chemistry.)