
Page 59 - Optofluidics Fundamentals, Devices, and Applications
P. 59
40 Cha pte r T h ree
2
3-4-2 L Interfaces Are Smooth
Unlike their solid-state counterparts, polishing or high-precision fabri-
2
cation is not necessary to obtain smooth optical surfaces in L devices.
2
Because of their small length scale, L devices operate in the low Reyn-
olds number regime, and the flow is laminar (i.e., nonturbulent). Fluid
flows at low Reynolds number generate an intrinsically optically
smooth interface between streams of liquids. Small irregularities in the
solid walls of the channels (having roughness of r) do not propagate
into the liquid interfaces, as long as the width of the flowing streams is
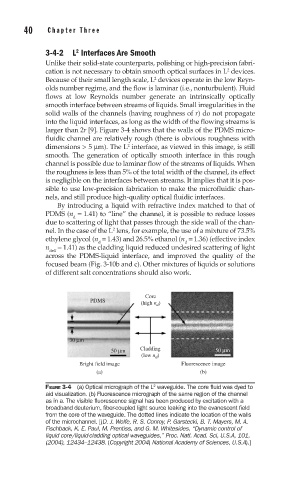
larger than 2r [9]. Figure 3-4 shows that the walls of the PDMS micro-
fluidic channel are relatively rough (there is obvious roughness with
dimensions > 5 μm). The L interface, as viewed in this image, is still
2
smooth. The generation of optically smooth interface in this rough
channel is possible due to laminar flow of the streams of liquids. When
the roughness is less than 5% of the total width of the channel, its effect
is negligible on the interfaces between streams. It implies that it is pos-
sible to use low-precision fabrication to make the microfluidic chan-
nels, and still produce high-quality optical fluidic interfaces.
By introducing a liquid with refractive index matched to that of
PDMS (n = 1.41) to “line” the channel, it is possible to reduce losses
d
due to scattering of light that passes through the side wall of the chan-
2
nel. In the case of the L lens, for example, the use of a mixture of 73.5%
ethylene glycol (n = 1.43) and 26.5% ethanol (n = 1.36) (effective index
d d
n = 1.41) as the cladding liquid reduced undesired scattering of light
deff
across the PDMS-liquid interface, and improved the quality of the
focused beam (Fig. 3-10b and c). Other mixtures of liquids or solutions
of different salt concentrations should also work.
Core
PDMS (high n d )
30 μm
Cladding
50 μm 50 μm
(low n d )
Bright field image Fluorescence image
(a) (b)
2
FIGURE 3-4 (a) Optical micrograph of the L waveguide. The core fl uid was dyed to
aid visualization. (b) Fluorescence micrograph of the same region of the channel
as in a. The visible fl uorescence signal has been produced by excitation with a
broadband deuterium, fi ber-coupled light source leaking into the evanescent fi eld
from the core of the waveguide. The dotted lines indicate the location of the walls
of the microchannel. [(D. J. Wolfe, R. S. Conroy, P. Garstecki, B. T. Mayers, M. A.
Fischback, K. E. Paul, M. Prentiss, and G. M. Whitesides, “Dynamic control of
liquid core/liquid-cladding optical waveguides,” Proc. Natl. Acad. Sci, U.S.A, 101,
(2004), 12434–12438. (Copyright 2004) National Academy of Sciences, U.S.A).]