
Page 464 - Orlicky's Material Requirements Planning
P. 464
442 PART 4 Looking Backward and Forward
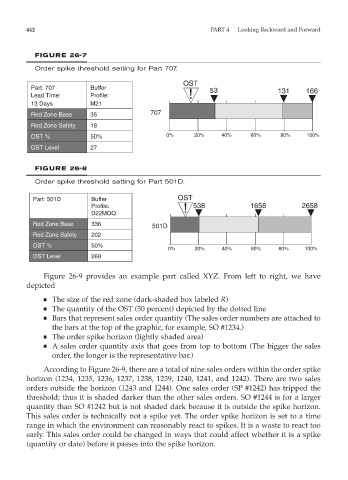
FIGURE 26-7
Order spike threshold setting for Part 707.
OST
Part: 707 Buffer 53 131 166
Lead Time: Profile: !
13 Days M21
Red Zone Base 35 707
Red Zone Safety 18
OST % 50% 0% 20% 40% 60% 80% 100%
OST Level 27
FIGURE 26-8
Order spike threshold setting for Part 501D.
Part: 501D Buffer OST
Profile: ! 538 1658 2658
D22MOQ
Red Zone Base 336 501D
Red Zone Safety 202
OST % 50%
0% 20% 40% 60% 80% 100%
OST Level 269
Figure 26-9 provides an example part called XYZ. From left to right, we have
depicted
■ The size of the red zone (dark-shaded box labeled R)
■ The quantity of the OST (50 percent) depicted by the dotted line
■ Bars that represent sales order quantity (The sales order numbers are attached to
the bars at the top of the graphic, for example, SO #1234.)
■ The order spike horizon (lightly shaded area)
■ A sales order quantity axis that goes from top to bottom (The bigger the sales
order, the longer is the representative bar.)
According to Figure 26-9, there are a total of nine sales orders within the order spike
horizon (1234, 1235, 1236, 1237, 1238, 1239, 1240, 1241, and 1242). There are two sales
orders outside the horizon (1243 and 1244). One sales order (SP #1242) has tripped the
threshold; thus it is shaded darker than the other sales orders. SO #1244 is for a larger
quantity than SO #1242 but is not shaded dark because it is outside the spike horizon.
This sales order is technically not a spike yet. The order spike horizon is set to a time
range in which the environment can reasonably react to spikes. It is a waste to react too
early. This sales order could be changed in ways that could affect whether it is a spike
(quantity or date) before it passes into the spike horizon.