
Page 465 - Orlicky's Material Requirements Planning
P. 465
CHAPTER 26 Demand-Driven Planning 443
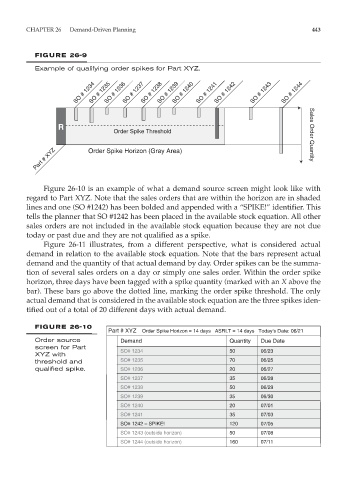
FIGURE 26-9
Example of qualifying order spikes for Part XYZ.
SO # 1234 SO # 1235 SO # 1236 SO # 1237 SO # 1238 SO # 1239 SO # 1240 SO # 1241 SO # 1242 SO # 1243 SO # 1244
R
Order Spike Threshold Sales Order Quantity
Part # XYZ Order Spike Horizon (Gray Area)
Figure 26-10 is an example of what a demand source screen might look like with
regard to Part XYZ. Note that the sales orders that are within the horizon are in shaded
lines and one (SO #1242) has been bolded and appended with a “SPIKE!” identifier. This
tells the planner that SO #1242 has been placed in the available stock equation. All other
sales orders are not included in the available stock equation because they are not due
today or past due and they are not qualified as a spike.
Figure 26-11 illustrates, from a different perspective, what is considered actual
demand in relation to the available stock equation. Note that the bars represent actual
demand and the quantity of that actual demand by day. Order spikes can be the summa-
tion of several sales orders on a day or simply one sales order. Within the order spike
horizon, three days have been tagged with a spike quantity (marked with an X above the
bar). These bars go above the dotted line, marking the order spike threshold. The only
actual demand that is considered in the available stock equation are the three spikes iden-
tified out of a total of 20 different days with actual demand.
FIGURE 26-10
Part # XYZ Order Spike Horizon = 14 days ASRLT = 14 days Today’s Date: 06/21
Order source Demand Quantity Due Date
screen for Part
SO# 1234 50 06/23
XYZ with
threshold and SO# 1235 70 06/25
qualified spike. SO# 1236 20 06/27
SO# 1237 35 06/28
SO# 1238 50 06/29
SO# 1239 35 06/30
SO# 1240 20 07/01
SO# 1241 35 07/03
SO# 1242 – SPIKE! 120 07/05
SO# 1243 (outside horizon) 50 07/08
SO# 1244 (outside horizon) 160 07/11