
Page 469 - Orlicky's Material Requirements Planning
P. 469
CHAPTER 26 Demand-Driven Planning 447
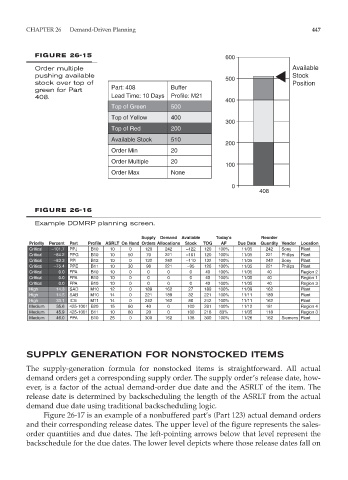
FIGURE 26-15 600
Order multiple Available
pushing available 500 Stock
stock over top of Position
green for Part Part: 408 Buffer
408. Lead Time: 10 Days Profile: M21
400
Top of Green 500
Top of Yellow 400
300
Top of Red 200
Available Stock 510
200
Order Min 20
Order Multiple 20
100
Order Max None
0
408
FIGURE 26-16
Example DDMRP planning screen.
Supply Demand Available Today’s Reorder
Priority Percent Part Profile ASRLT On Hand Orders Allocations Stock TOG AF Due Date Quantity Vendor Location
Critical –101.7 PPJ B10 10 0 120 242 –122 120 100% 11/05 242 Sony Plant
Critical –84.2 PPG B10 10 50 70 221 –101 120 100% 11/05 221 Philips Plant
Critical –83.3 PPI B12 10 0 132 242 –110 132 100% 11/05 242 Sony Plant
Critical –75.4 PPE B11 10 30 96 221 –95 126 100% 11/05 221 Philips Plant
Critical 0.0 FPA B10 10 0 0 0 0 40 100% 11/05 40 Region 2
Critical 0.0 FPA B10 10 0 0 0 0 40 100% 11/05 40 Region 1
Critical 0.0 FPA B10 10 0 0 0 0 40 100% 11/05 40 Region 3
High 14.3 SAD M10 12 0 189 162 27 189 100% 11/09 162 Plant
High 14.5 SAB M10 14 0 221 189 32 221 100% 11/11 189 Plant
High 33.1 ICB M11 14 0 242 162 80 242 100% 11/11 162 Plant
Medium 35.6 425-1001 B20 15 60 40 0 100 281 100% 11/12 181 Region 4
Medium 45.9 425-1001 B11 10 80 20 0 100 218 83% 11/05 118 Region 3
Medium 46.0 PPA B10 25 0 300 162 138 300 100% 11/26 162 Siemens Plant
SUPPLY GENERATION FOR NONSTOCKED ITEMS
The supply-generation formula for nonstocked items is straightforward. All actual
demand orders get a corresponding supply order. The supply order’s release date, how-
ever, is a factor of the actual demand-order due date and the ASRLT of the item. The
release date is determined by backscheduling the length of the ASRLT from the actual
demand due date using traditional backscheduling logic.
Figure 26-17 is an example of a nonbuffered part’s (Part 123) actual demand orders
and their corresponding release dates. The upper level of the figure represents the sales-
order quantities and due dates. The left-pointing arrows below that level represent the
backschedule for the due dates. The lower level depicts where those release dates fall on