
Page 55 - Phase Space Optics Fundamentals and Applications
P. 55
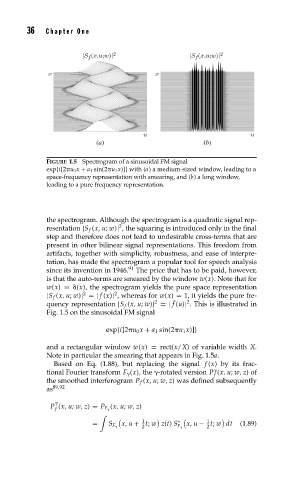
36   Chapter One


                                  2                            2
                         |S f (x,u;w)|                 |S f (x,u;w)|
                x                            x


                                          u                            u
                             (a)                          (b)

               FIGURE 1.5 Spectrogram of a sinusoidal FM signal
               exp{i[2 u 0 x + a 1 sin(2 u 1 x)]} with (a) a medium-sized window, leading to a
               space-frequency representation with smearing, and (b) a long window,
               leading to a pure frequency representation.


               the spectrogram. Although the spectrogram is a quadratic signal rep-
                                   2
               resentation |S f (x, u; w)| , the squaring is introduced only in the final
               step and therefore does not lead to undesirable cross-terms that are
               present in other bilinear signal representations. This freedom from
               artifacts, together with simplicity, robustness, and ease of interpre-
               tation, has made the spectrogram a popular tool for speech analysis
               since its invention in 1946. 91  The price that has to be paid, however,
               is that the auto-terms are smeared by the window w(x). Note that for
               w(x) =  (x), the spectrogram yields the pure space representation
                          2
                                  2
               |S f (x, u; w)| =| f (x)| , whereas for w(x) = 1, it yields the pure fre-
                                                  ¯
                                                      2
                                             2
               quency representation |S f (x, u; w)| =| f (u)| . This is illustrated in
               Fig. 1.5 on the sinusoidal FM signal
                                exp{i[2 u 0 x + a 1 sin(2 u 1 x)]}
               and a rectangular window w(x) = rect(x/X) of variable width X.
               Note in particular the smearing that appears in Fig. 1.5a.
                 Based on Eq. (1.88), but replacing the signal f (x) by its frac-

               tional Fourier transform F   (x), the  -rotated version P (x, u; w, z)of
                                                             f
               the smoothed interferogram P f (x, u; w, z) was defined subsequently
               as 89,92

                  f
                 P (x, u; w, z) = P F   (x, u; w, z)

                                          1                1
                            =   S F    x, u + t; w z(t) S ∗  x, u − t; w dt  (1.89)
                                          2        F       2