
Page 114 - Phase-Locked Loops Design, Simulation, and Applications
P. 114
MIXED-SIGNAL PLL ANALYSIS Ronald E. Best 75
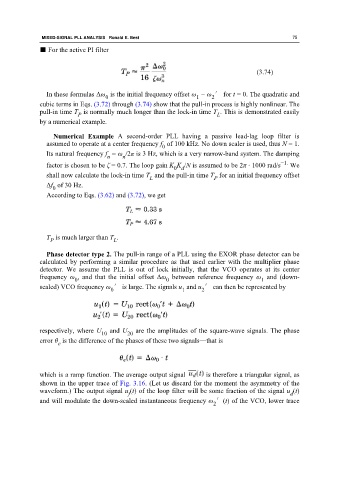
■ For the active PI filter
(3.74)
In these formulas Δω is the initial frequency offset ω − ω ′ for t = 0. The quadratic and
0 1 2
cubic terms in Eqs. (3.72) through (3.74) show that the pull-in process is highly nonlinear. The
pull-in time T is normally much longer than the lock-in time T . This is demonstrated easily
P
L
by a numerical example.
Numerical Example A second-order PLL having a passive lead-lag loop filter is
assumed to operate at a center frequency f of 100 kHz. No down scaler is used, thus N = 1.
0
Its natural frequency f = ω /2π is 3 Hz, which is a very narrow-band system. The damping
n n
factor is chosen to be ζ = 0.7. The loop gain K K /N is assumed to be 2π · 1000 rad/s −1. We
0 d
shall now calculate the lock-in time T and the pull-in time T for an initial frequency offset
L P
Δf of 30 Hz.
0
According to Eqs. (3.62) and (3.72), we get
T is much larger than T .
L
P
Phase detector type 2. The pull-in range of a PLL using the EXOR phase detector can be
calculated by performing a similar procedure as that used earlier with the multiplier phase
detector. We assume the PLL is out of lock initially, that the VCO operates at its center
frequency ω , and that the initial offset Δω between reference frequency ω and (down-
0 0 1
scaled) VCO frequency ω ′ is large. The signals u and u ′ can then be represented by
0
2
1
respectively, where U and U are the amplitudes of the square-wave signals. The phase
20
10
error θ is the difference of the phases of these two signals—that is
e
which is a ramp function. The average output signal is therefore a triangular signal, as
shown in the upper trace of Fig. 3.16. (Let us discard for the moment the asymmetry of the
waveform.) The output signal u (t) of the loop filter will be some fraction of the signal u (t)
f d
and will modulate the down-scaled instantaneous frequency ω ′(t) of the VCO, lower trace
2