
Page 116 - Phase-Locked Loops Design, Simulation, and Applications
P. 116
MIXED-SIGNAL PLL ANALYSIS Ronald E. Best 76
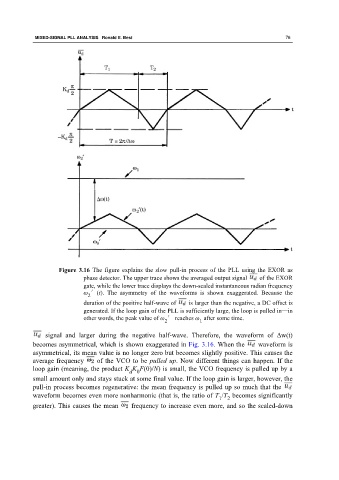
Figure 3.16 The figure explains the slow pull-in process of the PLL using the EXOR as
phase detector. The upper trace shows the averaged output signal of the EXOR
gate, while the lower trace displays the down-scaled instantaneous radian frequency
ω ′(t). The asymmetry of the waveforms is shown exaggerated. Because the
2
duration of the positive half-wave of is larger than the negative, a DC offset is
generated. If the loop gain of the PLL is sufficiently large, the loop is pulled in—in
other words, the peak value of ω ′ reaches ω after some time.
1
2
signal and larger during the negative half-wave. Therefore, the waveform of Δw(t)
becomes asymmetrical, which is shown exaggerated in Fig. 3.16. When the waveform is
asymmetrical, its mean value is no longer zero but becomes slightly positive. This causes the
average frequency of the VCO to be pulled up. Now different things can happen. If the
loop gain (meaning, the product K K F(0)/N) is small, the VCO frequency is pulled up by a
d 0
small amount only and stays stuck at some final value. If the loop gain is larger, however, the
pull-in process becomes regenerative: the mean frequency is pulled up so much that the
waveform becomes even more nonharmonic (that is, the ratio of T /T becomes significantly
1 2
greater). This causes the mean frequency to increase even more, and so the scaled-down